
Chapter 19. The Macroeconomic Perspective
19.3 Tracking Real GDP over Time
Learning Objectives
- Explain recessions, depressions, peaks, and troughs
- Evaluate the importance of tracking real GDP over time
- Analyze the impact of economic fluctuations on a country’s output and price level
When news reports indicate that “the economy grew 1.2% in the first quarter,” the reports are referring to the percentage change in real GDP. By convention, GDP growth is reported at an annualized rate: Whatever the calculated growth in real GDP was for the quarter, it is multiplied by four when it is reported as if the economy were growing at that rate for a full year.
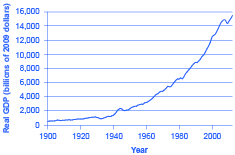
Figure 1 shows the pattern of U.S. real GDP since 1900. The generally upward long-term path of GDP has been regularly interrupted by short-term declines. A significant decline in real GDP is called a recession. An especially lengthy and deep recession is called a depression. The severe drop in GDP that occurred during the Great Depression of the 1930s is clearly visible in the figure, as is the Great Recession of 2008–2009.
Real GDP is important because it is highly correlated with other measures of economic activity, like employment and unemployment. When real GDP rises, so does employment.
The most significant human problem associated with recessions (and their larger, uglier cousins, depressions) is that a slowdown in production means that firms need to lay off or fire some of the workers they have. Losing a job imposes painful financial and personal costs on workers, and often on their extended families as well. In addition, even those who keep their jobs are likely to find that wage raises are scanty at best—or they may even be asked to take pay cuts.
Table 9 lists the pattern of recessions and expansions in the U.S. economy since 1900. The highest point of the economy, before the recession begins, is called the peak; conversely, the lowest point of a recession, before a recovery begins, is called the trough. Thus, a recession lasts from peak to trough, and an economic upswing runs from trough to peak. The movement of the economy from peak to trough and trough to peak is called the business cycle. It is intriguing to notice that the three longest trough-to-peak expansions of the twentieth century have happened since 1960. The most recent recession started in December 2007 and ended formally in June 2009. This was the most severe recession since the Great Depression of the 1930’s.
| Trough | Peak | Months of Contraction | Months of Expansion |
|---|---|---|---|
| December 1900 | September 1902 | 18 | 21 |
| August 1904 | May 1907 | 23 | 33 |
| June 1908 | January 1910 | 13 | 19 |
| January 1912 | January 1913 | 24 | 12 |
| December 1914 | August 1918 | 23 | 44 |
| March 1919 | January 1920 | 7 | 10 |
| July 1921 | May 1923 | 18 | 22 |
| July 1924 | October 1926 | 14 | 27 |
| November 1927 | August 1929 | 23 | 21 |
| March 1933 | May 1937 | 43 | 50 |
| June 1938 | February 1945 | 13 | 80 |
| October 1945 | November 1948 | 8 | 37 |
| October 1949 | July 1953 | 11 | 45 |
| May 1954 | August 1957 | 10 | 39 |
| April 1958 | April 1960 | 8 | 24 |
| February 1961 | December 1969 | 10 | 106 |
| November 1970 | November 1973 | 11 | 36 |
| March 1975 | January 1980 | 16 | 58 |
| July 1980 | July 1981 | 6 | 12 |
| November 1982 | July 1990 | 16 | 92 |
| March 2001 | November 2001 | 8 | 120 |
| December 2007 | June 2009 | 18 | 73 |
| Table 9. U.S. Business Cycles since 1900. (Source: http://www.nber.org/cycles/main.html) | |||
A private think tank, the National Bureau of Economic Research (NBER), is the official tracker of business cycles for the U.S. economy. However, the effects of a severe recession often linger on after the official ending date assigned by the NBER.
Key Concepts and Summary
Over the long term, U.S. real GDP have increased dramatically. At the same time, GDP has not increased the same amount each year. The speeding up and slowing down of GDP growth represents the business cycle. When GDP declines significantly, a recession occurs. A longer and deeper decline is a depression. Recessions begin at the peak of the business cycle and end at the trough.
Self-Check Questions
- Without looking at Table 9, return to Figure 1. If a recession is defined as a significant decline in national output, can you identify any post-1960 recessions in addition to the recession of 2008–2009? (This requires a judgment call.)
- According to Table 9, how often have recessions occurred since the end of World War II (1945)?
- According to Table 9, how long has the average recession lasted since the end of World War II?
- According to Table 9, how long has the average expansion lasted since the end of World War II?
Review Questions
What are the typical patterns of GDP for a high-income economy like the United States in the long run and the short run?
Critical Thinking Questions
- Why do you suppose that U.S. GDP is so much higher today than 50 or 100 years ago?
- Why do you think that GDP does not grow at a steady rate, but rather speeds up and slows down?
References
The National Bureau of Economic Research. “Information on Recessions and Recoveries, the NBER Business Cycle Dating Committee, and related topics.” http://www.nber.org/cycles/main.html.
Glossary
- business cycle
- the relatively short-term movement of the economy in and out of recession
- depression
- an especially lengthy and deep decline in output
- peak
- during the business cycle, the highest point of output before a recession begins
- recession
- a significant decline in national output
- trough
- during the business cycle, the lowest point of output in a recession, before a recovery begins
Solutions
Answers to Self-Check Questions
- Two other major recessions are visible in the figure as slight dips: those of 1973–1975, and 1981–1982. Two other recessions appear in the figure as a flattening of the path of real GDP. These were in 1990–1991 and 2001.
- 11 recessions in approximately 70 years averages about one recession every six years.
- The table lists the “Months of Contraction” for each recession. Averaging these figures for the post-WWII recessions gives an average duration of 11 months, or slightly less than a year.
- The table lists the “Months of Expansion.” Averaging these figures for the post-WWII expansions gives an average expansion of 60.5 months, or more than five years.
