
Chapter 11: General Circulation
Alison Nugent and David DeCou
Learning Objectives
By the end of this chapter, you should be able to:
- Describe the differential heating Earth experiences, and how heat is redistributed
- Diagram vertical atmospheric circulations (Hadley cell, Ferrel cell, Polar cell)
- Diagram surface wind directions (trade winds, belt of westerlies, etc.)
- Discuss the distribution of heat over Earth’s surface and how it drives global circulation, including its connection to the Coriolis force
Introduction
The focus of this chapter is on the typical wind circulations found on Earth as a result of the forces affecting wind in the atmosphere, as introduced in Chapter 10. The average global winds are called the general circulation of the atmosphere. To find typical wind circulations, one needs to average wind speed and duration over a long period of time. Averaging over time removes short duration fluctuations, allowing the primary sense of movement to be visualized.
The reason we have global wind patterns is ultimately due to a differentially heated, rotating Earth. The differential heating of Earth continually causes an imbalance in air pressure and temperature around the world, which in turn causes a continuous general circulation of winds that attempt to restore balance.
While actual winds in a given place and time may differ from the average general circulation, the average can provide an explanation for how and why the winds prevail from a particular direction in a certain place. For example, the prevailing surface winds tend to be westerly in the continental United States, but northeasterly in Hawai’i. The general circulation also serves as a model for how heat and momentum are transported from the equator to the poles.
Differential Heating
Because the Earth is round, solar radiation is not equally spread at all latitudes. Near the equator where sunlight shines directly on Earth, more solar radiation per square meter is received as compared to near the poles where sunlight shines at sharp angles to the surface (see image below). Toward Earth’s poles, the same solar radiation is spread over a larger surface area such that each square meter of Earth’s surface gets less radiation at the poles. As Earth rotates, the incoming solar radiation is zonally spread along latitude lines.

In this way, incoming solar radiation depends on latitude. The sun shines more directly on tropical regions at lower latitudes than at higher latitudes all year-round. Solar radiation adds heat to the Earth-atmosphere-ocean system, and thus lower latitudes get heated more than higher latitudes. This should be as expected because we know the tropics are warmer than the polar regions.
While Earth is continually heated by the sun, it is also continually losing energy by emitting outgoing longwave infrared (IR) radiation at all latitudes, and at all times, both on the light and the dark side of the globe. You’ll recall from Chapter 2 that IR radiation is emitted by Earth according to the Stefan-Boltzman law, which is highly dependent on temperature.
When averaged over the globe and over long time scales, incoming UV radiation exactly balances outgoing IR radiation. But, latitude by latitude, incoming UV and outgoing do not perfectly balance. More solar energy is received by the Earth in the tropics, and while the cooling by outgoing IR radiation helps to offset this, there is still a net gain of radiative energy in the tropics. However, near Earth’s poles, incoming solar radiation is less direct and too weak to offset the cooling by outgoing IR radiation, so there is net cooling at the poles. This causes warmer air at the equator, and cold air at the poles and drives Earth’s atmospheric general circulation.

The above image illustrates this more directly. Incoming solar radiation is focused near the equator, while outgoing IR radiation is relatively evenly spread across all latitudes. This results in the below energy surplus near the equator and deficit toward the poles.

Earth’s general circulation attempts to redistribute heat around the globe and rebalance the energy imbalances inherent in an unevenly heated, rotating planet. However, the general circulation cannot instantly balance global temperature, especially when the uneven heating is continuous. Therefore, a meridional temperature gradient always remains.
In an attempt to balance out Earth’s incoming and outgoing energy, warm air is transported toward the poles, while cool air flows back toward the equator. This seems simple enough. However, this seemingly simple flow is complicated by many factors, including Earth’s rotation, the position of continents, interactions with the oceans and many others. In order to build an understanding of this process, we’ll start with some simplified models and build complexity.
Single-Cell Model
The first model we’ll examine is the single-cell model. With this model, we make the following assumptions.
- The earth is entirely covered with water. This is to remove any land-sea interactions.
- There are no seasons and the sun is always shining directly over the equator. This removes seasonal wind shifts.
- There is no Coriolis force. While the Earth rotates to spread heat along latitudinal lines, this allows us to only be concerned with the pressure gradient force.
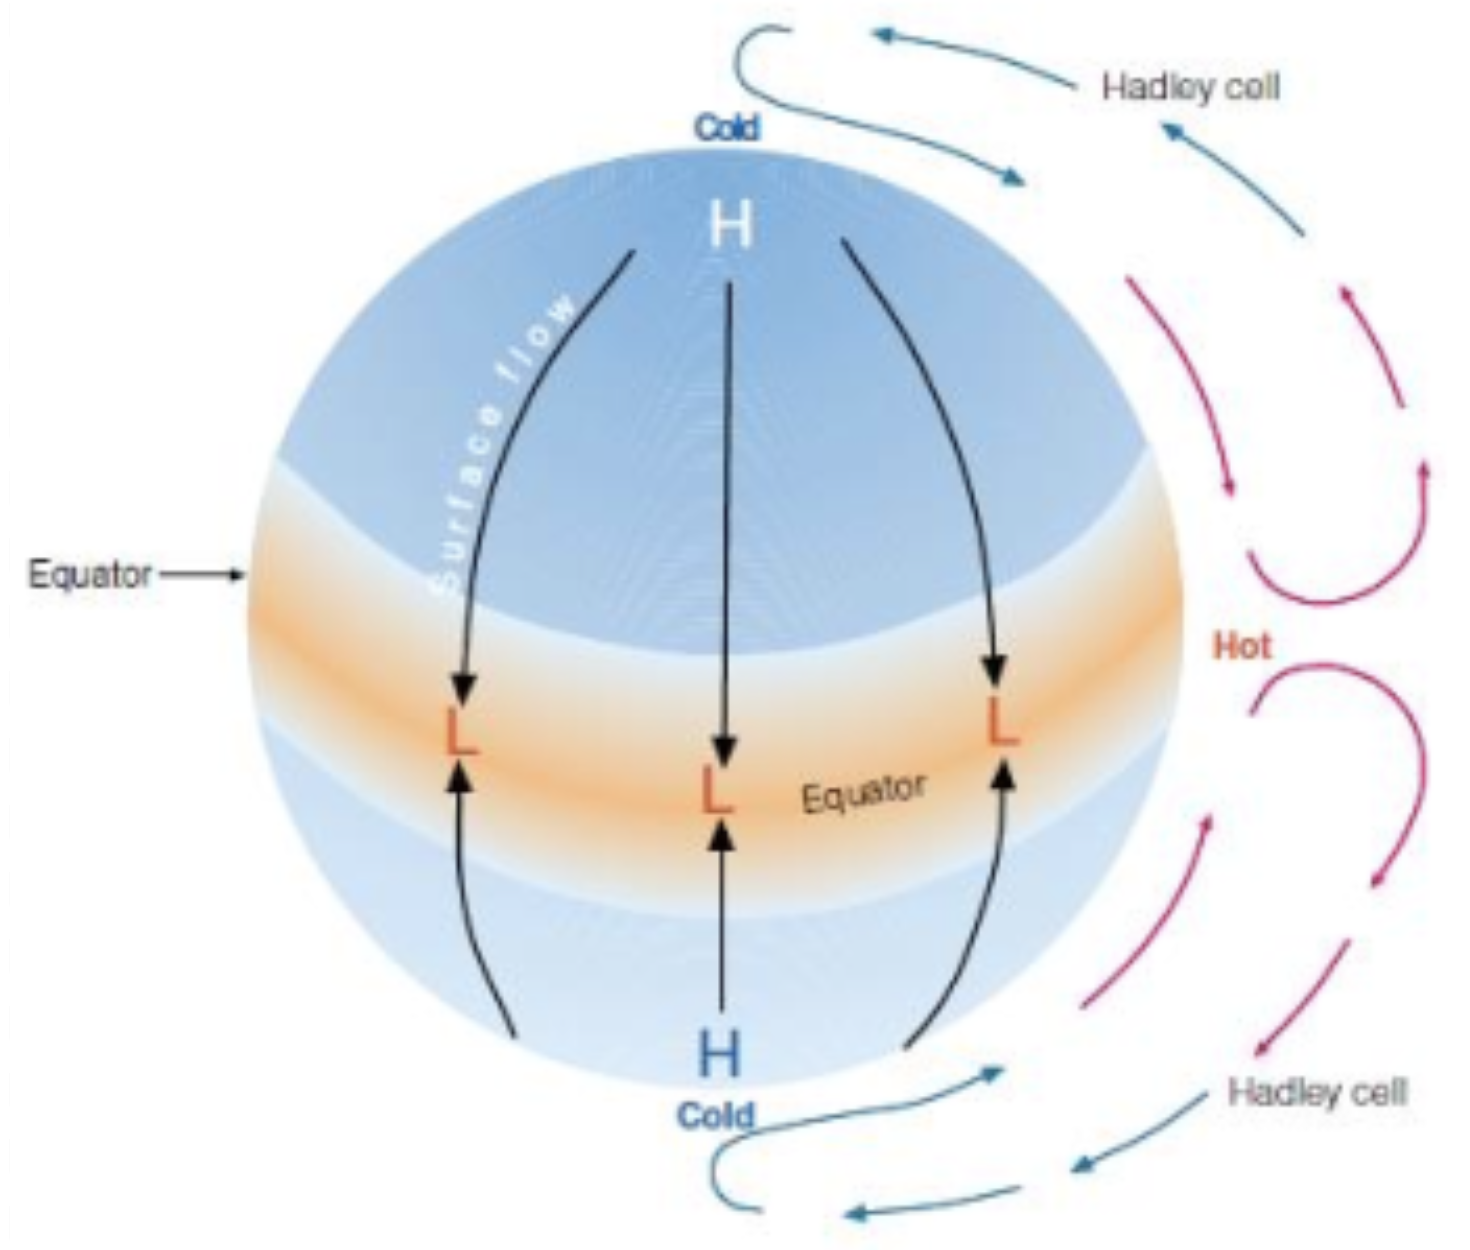
With these assumptions in place, Earth’s global circulation would like the figure below, with one giant vertically overturning cell in each hemisphere. The excess heating at the equator is transported poleward by rising warm air, which is replaced by cold sinking polar air moving equatorward. This circulation is known as the Hadley cell. The Hadley cell is known as a thermally direct circulation because in it, warm air is rising and cold air is sinking.
The circulation can be thought of in two ways. In the first, hot air at the equator rises because it is warm and buoyant. It reaches the tropopause, spreading laterally north and south at high elevations. To compensate for the rising air, surface air flows toward the equator, resulting in convergence and further uplift. Continuity of this circulation results in a global circulation with rising air at the equator and sinking air at the poles.
A second way to view global circulation is that the excess heating of air at the equator creates a large area of low pressure at the surface of the planet, while excess cooling at the poles creates high pressure at the surface. This global horizontal pressure gradient causes air to flow from high to low at the surface (pole to equator), where the air subsequently rises at the equator and flows back to the poles and sinks.
Both reasonings are plausible, its a matter of whether you focus on temperature or pressure. The temperature differences and the resulting pressure differences are intertwined and both important for the general circulation.
While this single-cell model can explain some phenomenon and works in some ways (and on some planetary bodies), it is not the reality on Earth. Earth is a rotating planet, so we need to consider the Coriolis force in addition to the pressure gradient force. In the single-cell model, as upper level air flows from the equator toward the poles, it would be deflected by the Coriolis force. In the northern hemisphere, for example, this deflection would be toward the right resulting in a wind from west to east at upper levels. In this way, the air moving from the equator to the poles would never make it there because of the rotation of Earth. A different model is needed.
Three-Cell Model
If we allow for the effects of a rotating planet, the simple single-cell model above breaks down into multiple cells in each hemisphere as shown in the figure below. It may look more complex and unrelated to the single-cell model, but there are many similarities from above. There is still excess heating in equatorial regions and excess cooling in polar regions. Instead of heat being redistributed by one massive Hadley cell from the equator to the poles, there are now three convective cells. The first of these is still the same thermally direct Hadley cell from before, but now it extends only from the equator to about 30° latitude. The poles still have a large high pressure system, while the equator has a large belt of low pressure along it. Let’s take a closer look at what happens to the rising air just above the equator.

At the equator, the air near the surface is warm, winds are light, and the pressure gradient is weak. This region of monotonous weather is known as the doldrums. The warm air here rises, condensing into massive cumulonimbus clouds and thunderstorms, which release large amounts of latent heat as they form. The additional heat makes the air even more likely to rise, and provides the energy that drives the rising branch of the Hadley cell. This rising air reaches the stable tropopause, which blocks it from rising further, causing the air to diverge at upper levels and move poleward. Due to the Coriolis force, this upper level poleward flow is deflected to the right in the Northern Hemisphere and to the left in the Southern Hemisphere, providing westerlies aloft (near the tropopause) in both hemispheres in the Hadley cell.
As air moves poleward from equatorial regions, it is constantly experiencing radiational cooling as it emits infrared radiation. Simultaneously, this air begins to converge and pile up as it approaches the mid-latitudes (around 30° latitude in both hemispheres). This convergence of air far above the surface increases the mass of air aloft, increasing the pressure at the surface. This increase in surface pressure results in a belt of high pressure centers called subtropical highs around 30°N and 30°S. These latitudes are commonly known as the horse latitudes.
As this converging air above the subtropical highs slowly descends, it warms adiabatically by compression. This sinking air, dries the atmosphere creating generally clear skies and little rain. Over the oceans, weak pressure gradients in the high centers produce weak winds. Some of these lighter surface winds begin to move back toward the equator, and are deflected by the Coriolis force. This causes northeasterly winds in the Northern Hemisphere and southeasterly winds in the Southern Hemisphere in tropical regions. These winds are known as the trade winds, and they have a strong influence over the daily wind patterns in Hawai’i. Near the equator, the northeasterly and southeasterly trade winds converge at the surface at what is known as the intertropical convergence zone (ITCZ). Here, convergence further reinforces the rising branch of the Hadley cell.
Back at 30° latitude, while some of the air sinking along the subtropical highs goes equatorward to complete the Hadley cell, some sinking air also moves poleward. This poleward moving surface air travels from from 30° to 60° and is again deflected by the Coriolis force. This results in the prevailing surface westerlies that impact the mid-latitudes in both hemispheres. It is for this reason that weather moves west to east across the continental US. Often, this westerly flow is interrupted by high and low pressure systems that move with the mean surface flow. We’ll learn more about this in the next two chapters. As the surface air travels poleward from 30° to 60°, it collides with cold polar air moving equatorward. These air masses do not mix easily, and are separated by a boundary known as the polar front. At the polar front, surface air converges and rises at the subpolar low, and storms and convection develop here. Some of this rising air goes all the way up to the tropopause where it moves back to 30° latitude and sinks at the subtropical high along with the descending branch of the Hadley cell. This circulation cell from 30° to 60° is known as the Ferrel cell, which is a thermally indirect circulation in which cool air rises and warm air sinks.
Behind the polar front in the Northern hemisphere, cold surface polar air moves from the poles toward 60°. As the air moves equatorward, it is again deflected by the Coriolis force. In the Arctic regions, air typically flows from the northeast while in the Antarctic, air flows from the southeast. These are known as the polar easterlies. Along the polar front where cold polar air collides with warm air from the Ferrel cell, some of the rising air moves back toward the poles, which gets deflected as a westerly wind aloft. Eventually this air reaches the poles, sinks back to the surface, and flows back toward the polar front, which gives us the Polar cell.
To summarize, looking back at the three-cell model picture: there are two major belts of high pressure and two major belts of low pressure in each hemisphere (if you include the equator in both). Areas of high pressure and sinking air exist near 30° latitude and at the poles. Regions of low pressure and rising air exist over the equator and near 60° latitude by the polar front. By knowing that winds travel counterclockwise (clockwise) around low pressure systems in the Northern Hemisphere (Southern Hemisphere), and clockwise (counterclockwise) around high pressure systems in the Northern Hemisphere (Southern Hemisphere), you can get a pretty general idea of how surface winds blow around the world on average. Trade winds blow from the subtropical highs at 30° to the equator, the westerlies blow from the subtropical highs to the polar front, and the polar easterlies blow from the poles to the polar front at the surface. Areas where these winds converge will have rising motion and low pressure at the surface, and regions where these winds diverge will have sinking motion and high pressure at the surface.
How does this three-cell model match with reality? While some minor discrepancies exist, for example in reality much of the upper-level winds in the mid-latitudes are westerly like the surface, while the Ferrel cell suggests there should be easterly winds aloft. However, this model is roughly accurate for surface winds and provides a really good first order pattern for general circulation.

How does the real world’s average surface sea level pressure field compare with the above picture? When we add in the continents, ice masses, oceans, mountains, and forest, we get an average that looks something like the below two figures. The following maps show the mean sea-level pressure field for January and July, averaged from 1981 to 2010.
Looking at the two maps below, you may notice that there are some areas where low and high pressure systems seem to persist throughout the year – these are known as semipermanent highs and semipermanent lows. These include the Bermuda-Azores High, the Pacific High, the Icelandic Low, and the Aleutian Low.


Global Surface Winds
The following graphic nicely illustrates all of the above phenomenon for global surface winds. The polar easterlies, mid-latitude westerlies, and tropical trade winds are all visible. Now with the continents and land masses added, we are able to see where on Earth these surface winds are observed.

Jet streams
There is one final important piece of general circulation that deserves a discussion, and that is jet streams. In the below image you can see two jet streams: the subtropical jet and the polar jet. The figure shows the average position of the jet streams in the Northern Hemisphere in the winter, as well as their relation to the tropopause. The figure shows jet streams flowing from west to east. We can see that there are two jets located right under the tropopause. The subtropical jet stream is located near 30° latitude about 13 km up, above the tropical high. The polar jet stream is located near the polar front about 10 km up, near 50° to 60° latitude. The difference in height of these jets is due to their location at the tropopause, and the fact that the tropopause is found higher in tropical regions than in polar regions due to average layer temperature differences of the troposphere underneath. The troposphere is thinner in polar regions than in tropical regions due to colder, denser air at the poles.

If the general circulation of the atmosphere is like a giant meandering river of air around the globe, then jet streams are swiftly flowing currents within that river. Jet streams are thousands of kilometers in length, and hundreds of kilometers in width. In the core of a jet stream (called a jet streak), wind speeds are often higher than 100 knots and are occasionally higher than 200 knots. The polar jet can sometimes merge with the subtropical jet if it sweeps southward enough, and it occasionally splits into two jet streams.

The existence of jet streams is ultimately due to the energy imbalance between tropical and polar regions. How exactly do they form? As mentioned before, the polar front is a boundary between colder polar air and warmer subtropical air. Because of this, the strongest temperature gradient occurs along the polar frontal zone. This rapid change of temperature with distance also causes a rapid pressure change, due to the thermal wind effect (a vertical shear in the geostrophic wind caused by a horizontal temperature gradient). This strong pressure gradient across the polar front causes intense wind speeds that become the jet stream. The temperature contrast between north and south along the polar front is more intense during the winter than during the summer, so the polar jet is also stronger during the winter. During winter, the leading edge of the cold polar air pushes further south into subtropical areas. During the summer, the polar front retreats into higher latitudes and is weakened.
The subtropical jet stream tends to form just above the descending branch of the Hadley cell, at about 12 km altitude. Here, a boundary exists between warmer equatorial air and cooler air that has been cycled up and around the Ferrel cell from the polar front. This is sometimes referred to as the subtropical front, but it does not extend all the way to the surface. Here, the temperature gradient is strongest aloft near the tropopause, which induces a sharp pressure gradient and strong winds aloft as well.
One final thought for Chapter 11: isn’t it fascinating that all of these global winds are caused by differential heating and the rotation of Earth? Everything is connected in one way or another and fits together like a puzzle.
Chapter 11: Questions to Consider
-
- What assumptions are made for a single-cell model of Earth’s atmosphere?
- Drag the terms to their correct position:
- Where are jet streams located? Why do they differ in height?
Selected Practice Question Answers: