
Private: Main Body
7 Understanding the Fossil Context
Sarah S. King, Ph.D., Cerro Coso Community College
Lee Anne Zajicek, B.A.
Learning Objectives
- Describe how the Age of Wonder advanced scientific inquiry and helped develop modern anthropological methods.
- Identify the different types of fossils and describe how they are formed.
- Discuss relative and chronometric dating methods, the type of material they analyze, and their applications.
- Describe the methods used to reconstruct past environments.
FOSSIL STUDY: AN EVOLVING PROCESS
Mary Anning and the Age of Wonder

Mary Anning (1799–1847) is likely the most famous fossil hunter you’ve never heard of (Figure 7.1). Anning lived her entire life in Lyme Regis on the Dorset coast in England. As a woman, born to a poor family, with a minimal education (even by 19th-century standards), the odds were against Anning becoming a scientist (Emling 2011, xii). It was remarkable that Anning was eventually able to influence the great scientists of the day with her fossil discoveries and her subsequent hypotheses regarding evolution.

The time when Anning lived was a remarkable period in human history because of the Industrial Revolution in Britain. Moreover, the scientific discoveries of the 18th century set the stage for great leaps of knowledge and understanding about humans and the natural world. Barely a century earlier, Sir Isaac Newton had developed his theories on physics and become the president of the Royal Society of London (Dolnick 2011, 5). In this framework, the pursuit of intellectual and scientific discovery became a popular avocation for many individuals, the vast majority of whom were wealthy men (Figure 7.2).

In spite of the expectations of Georgian English society to the contrary, Anning became a highly successful fossil hunter as well as a self-educated geologist and anatomist. The geology of Lyme Regis, with its limestone cliffs, provided a fortuitous backdrop for Anning’s lifework. Now called the “Jurassic Coast,” Lyme Regis has always been a rich source for fossilized remains (Figure 7.3). Continuing her father’s passion for fossil hunting, Anning scoured the crumbling cliffs after storms for fossilized remains and shells. The work was physically demanding and downright dangerous. In 1833, while searching for fossils, Anning lost her beloved dog in a landslide and nearly lost her own life in the process (Emling 2011).

Around the age of 10, Anning located and excavated a complete fossilized skeleton of an ichthyosaurus (“fish lizard”). She eventually found Pterodactylus macronyx and a 2.7-meter Plesiosaurus, considered by many to be her greatest discovery (Figure 7.4). These discoveries proved that there had been significant changes in the way living things appeared throughout the history of the world. Like many of her peers, including Darwin, Anning had strong religious convictions. However, the evidence that was being found in the fossil record was contradictory to the Genesis story in the Bible. In The Fossil Hunter: Dinosaurs, Evolution, and the Woman Whose Discoveries Changed the World, Anning’s biographer Shelley Emling (2011, 38) notes, “the puzzling attributes of Mary’s fossil [ichthyosaurus] struck a blow at this belief and eventually helped pave the way for a real understanding of life before the age of humans.”
Intellectual and scientific debate now had physical evidence to support the theory of evolution, which would eventually result in Darwin’s seminal work, On the Origin of Species (1859). Anning’s discoveries and theories were appreciated and advocated by her friends, intellectual men who were associated with the Geological Society of London. Regrettably, this organization was closed to women, and Anning received little official recognition for her contributions to the field of natural history and paleontology. Even today, Anning’s contributions are largely overlooked, a wrong that will be hopefully corrected. It is clear that Anning’s knowledge, diligence, and uncanny luck in finding magnificent specimens of fossils earned her unshakeable credibility and made her a peer to many antiquarians (Emling 2011).
Fossil hunting is still providing evidence and a narrative of the story of Earth. Mary Anning recognized the value of fossils in understanding natural history and relentlessly championed her theories to the brightest minds of her day. Anning’s ability to creatively think “outside the box”—skillfully assimilating knowledge from multiple academic fields—was her gift to our present understanding of the fossil record. Given how profoundly Anning has shaped how we, in the modern day, think about the origins of life, it is surprising that her contributions have been so marginalized. Anning’s name should be on the tip of everyone’s tongue. Fortunately, at least in one sense of the word, it is. The well-known tongue twister, below, was actually written about Mary Anning:
She sells sea-shells on the sea-shore
The shells she sells are sea-shells, I’m sure
For if she sells sea-shells on the sea-shore
Then I’m sure she sells sea-shore shells.
—T. Sullivan (1908)
Developing Modern Methods

Prior to the 19th century, the overwhelming majority of Westerners believed that the physical appearances of humans and all living things were unchanged since creation and that “Creation” was the work of “God,” as specified by the Holy Scriptures. To even consider that humans and animals might have evolved over time was practically an admission that the Christian God had made mistakes that needed correction in His creation of Earth and all living things (Emling 2011, 38). Thus, the Bible was viewed as a literal and rigid history of the world, and there was no tolerance for the possibility of natural forces in science to bring about change in speciation. To think otherwise was considered heresy and was punishable by excommunication from the Church—or even death. The limited vision imposed by the Church on this matter significantly restricted the way scholars could formulate hypotheses about natural history (Emling 2011, 39). In 1650, Bishop James Ussher made a famous calculation based on his study of the Old Testament that Creation occurred on Sunday (the first day of Creation), October 23, 4004 B.C. (Barr 1984, 575). Ussher’s chronology made sense in the face of limited evidence and the historical detail documented in the Bible. Many learned men, including Martin Luther, had made similar calculations using the Bible (Braterman 2013). Other physical evidence, such as prehistoric henges or megaliths, neatly fell into this timeline that the world was, at most, 6,000 years old. A dinosaur bone was discovered shortly after Ussher’s chronology had been published, but it was considered to have belonged to a giant human as the term “dinosaur” (“terrible lizard”) was not used until 1842. Fossils such as ammonites (Figure 7.5), vertebrae, and belemnites were often found in layers of crumbling cliffs. However, they were not recognized as the fossilized remains of creatures both extinct (terminated or vanished) and extant (still surviving). Instead, fossils were used in folk medicine or treasured as amulets for luck or protection. Because of a lack of evidence to the contrary and the overwhelming pressure of the Church, natural science was bordering on stagnation, and folklore unofficially explained most poorly understood natural phenomena. Simply put, “scientists were still trying to fit geologic evidence into Biblical chronology” (Einhard 1998).

However, during the Scientific Revolution, Scotsman James Hutton hypothesized about the formation of Earth and provided a much longer timeline of events, which would eventually support the theory of evolution. Hutton’s theory of Deep Time was crucial to the understanding of fossils. Deep Time gave the history of Earth enough time—4.543 billion years—to encompass continental drift, the evolution of species, and the fossilization process. A second Scotsman, Charles Lyell, propelled Hutton’s work into his own theory of uniformitarianism, the doctrine that Earth’s geologic formations are the work of slow geologic forces. Uniformitarianism was a theory that clashed with the church’s doctrine of catastrophism, the belief that Earth’s formation was due to a set of relatively quick biblical catastrophic events. Noah’s flood, as described in the book of Genesis, is an example of a catastrophic event. Lyell’s three-volume work, Principles of Geology (1830–1833), was influential to naturalist Charles Darwin (see Chapter 2 for more information on Darwin’s work). In fact, Lyell’s first volume accompanied Darwin on his five-year voyage around the world on the HMS Beagle (1831–1836). The concepts proposed by Lyell gave Darwin an opportunity to apply his working theories of evolution by natural selection and a greater length of time with which to work. These resulting theories were important scientific discoveries and paved the way for the “Age of Wonder,” or the second Scientific Revolution (Holmes 2010, xvi).
The work of Anning, Darwin, Lyell, and others laid the foundation for the modern methods we use today. Though anthropology is focused on humans and our primate relatives (and not dinosaurs as many people wrongly assume), you will see that methods developed in paleontology, geology, chemistry, biology, and physics are often applied in anthropological research. In this chapter, you will learn about the primary methods and techniques employed by biological anthropologists to answer questions about fossils, the mineralized copies of once-living organisms (Figure 7.6). Ultimately, these answers provide insights into human evolution. Pay close attention to ways in which modern biological anthropologists use other disciplines to analyze evidence and reconstruct past activities and environments.
EARTH: IT’S OLDER THAN DIRT

Scientists have developed precise and accurate dating methods based on work in the fields of physics and chemistry. Using these methods, scientists are able to establish the age of Earth as well as approximate ages of the organisms that have lived here. Earth is roughly 4.6 billion years old, give or take a few hundred million years. The first evidence for a living organism appeared around 3.5 billion years ago (bya). That is a huge amount of time to conceptualize, and many changes have taken place within that time. The scale of geologic time can seem downright overwhelming. In order to organize and make sense of Earth’s past, geologists break up that time into subunits. These subunits are human-made divisions along Earth’s timeline in the same way that inches and centimeters are human-made units that are used to divide up distance. The largest subunit is the eon. An eon is further divided into eras, and eras are divided into periods. Finally, periods are divided into epochs (see Figure 7.7) (Williams 2004, 37). Currently, we are living in the Phanerozoic eon, Cenozoic era, Quaternary period, and probably the Holocene epoch—though there is considerable academic debate about which epoch we are currently in.

Though these divisions are human-made and, to some extent, arbitrary, they are based on major changes and events recorded in the geologic record. Events like significant shifts in climate or mass extinctions can be used to mark the end of one geologic time unit and the beginning of another. However, it is important to remember that these borders are not real in a physical sense; they are merely helpful organizational guidelines for scientific research. The boundaries are not fixed, and there can be significant debate regarding exact dates and names of particular periods and epochs. For instance, the current epoch has been traditionally known as the Holocene. It began around 10 thousand years ago (kya) during the warming period after that last major ice age. Some anthropologists argued that it shouldn’t be called the Holocene because it might not be a new epoch; perhaps it is simply a warm blip in a larger epoch that includes the Pleistocene. Today, there is lots of evidence to indicate human-driven climate change is warming the world and changing the environmental patterns faster than the natural cyclical processes. This has led some scientists within the stratigraphic community to argue for a new epoch beginning around 1950 with the Nuclear Age called the Anthropocene (Monastersky 2015; Waters et al. n.d.). Nobel Laureate Paul Crutzen places the beginning of the Anthropocene much earlier—at the dawn of the Industrial Revolution, with its polluting effects of burning coal (Crutzen and Stoermer 2000, 17–18). Geologist William Ruddiman argues that the epoch began 5,000–8,000 years ago with the advent of agriculture and the buildup of early methane gases (Ruddiman et al. 2008). Regardless of when the Anthropocene started, the major event that marks the boundary is the warming temperatures and mass extinction of nonhuman species caused by human activity (Figure 7.8). Researchers now declare that “human activity now rivals geologic forces in influencing the trajectory of the Earth System” (Steffen et al. 2018, 1).
Geologic Processes

Through the study of fossils, anthropologists are able to learn a great deal about the history of Earth. If you were to closely examine the map of the world, you might notice that the seven continents seem to have outlines that could fit together if rotated and adjusted like puzzle pieces (Figure 7.9). Moreover, the geologic features of those puzzle pieces fit together and reveal many similarities. For instance, the White Cliffs of Dover, England, geologically match La Côte d’Albâtre (the Alabaster Coast) across the English Channel in France (Figures 7.10 and 7.11).


The shapes of the continents are easier to see from above and when looking at a map. From this perspective, it is not a far reach of the imagination to see how the shapes could fit together. However, in 1596, long before the advent of flight or space travel that would give such a perspective to a person studying geography, Abraham Ortelius theorized about the way the continents were shaped. Ortelius came up with the concept that one supercontinent called Pangea had existed much earlier in Earth’s history (USGS 2012). Approximately 200 million years ago (mya), Pangea started to slowly break apart, with the resulting pieces of land shifting and moving through the process of continental drift. In the late Triassic (roughly 135 mya), Pangea broke into two supercontinents called Laurasia and Gondwanaland, with additional movement that changed the physical representation of the landmasses and resulted in our current land configuration of seven continents. It is important to remember that continental drift continues to this day and will continue for the life of our planet. In another 250 million years, the map of Earth will look significantly different than it does today.

Ortelius’s theory made sense in some respects; after all, was it just sheer coincidence that the continents shared such complementary shapes? Yet the problem was that there was no scientific way to explain how continental drift occurred. Remember, too, that up until the late 1700s, the concept of Deep Time did not exist. In the absence of these vital pieces of information, it was impossible to explain what force would have been strong enough or how there was enough time in the history of the world to allow for the movement of huge masses of land to the various corners of the planet. In 1912, an answer was proposed, using the fossil record as evidence. Alfred Wegener used the fossilized remains of a fern, Glossopteris, that have been found on nearly every continent. He theorized that the only way this ancient plant could have existed in all of those areas was if the landmasses had been connected at some point in Earth’s early history. With this evidence (and much more), Wegener was able to develop his Tectonic Plate Theory. Simply put, Earth’s landmasses are relatively “thin, brittle fragments floating on top of hot, squishy material” (Murck 2001, p. 16). There is bound to be movement, even of large fragments. Furthermore, there are ridges or shelves in the Atlantic and Pacific Oceans that reflect the shifting of the planet’s crust. This theory not only supports the breakup of Pangea but also provides the basis for our current understanding of how earthquakes work. Physicists monitor the movement of tectonic plates for earthquake activity along known fault lines such as the San Andreas in California (Figure 7.12).

Besides the examples provided above, Pangea is also supported by the evidence found in the fauna of the fossil record. At the Gray Fossil Site in Gray, Tennessee, for instance, fossilized remains of the red panda (Pristinailurus bristoli) dating back four million years to the late Miocene era have been discovered (Figure 7.13). Red pandas are considered a “living fossil” because they have changed so little in millions of years and because they are represented in the fossil record. Today, red pandas are endangered and found exclusively in China and Nepal. Thus, the existence of the red panda in the Miocene in the Appalachian Mountains but living only in Asia today is clear evidence that the red panda moved freely and that our continents were part of a supercontinent (Wallace and Wang 2004, 556).
FOSSILS: PRESERVING PREHISTORIC LIFE
Taphonomy

Most of the evidence of human evolution comes from the study of the dead. To obtain as much information as possible from the remains of once-living creatures, one must understand the processes that occur after death. This is where taphonomy comes in (Figure 7.14). Taphonomy can be defined as the study of what happens to an organism after death (Komar and Buikstra 2008, 189; Stodder 2008). It includes the study of how an organism becomes a fossil. However, as you’ll see throughout this book, the majority of organisms never make it through the full fossilization process.
Taphonomy is extremely important in biological anthropology, especially in subdisciplines like bioarchaeology (study of human remains in the archaeological record) and zooarchaeology (the study of faunal remains from archaeological sites). It is so important that many scientists have recreated a variety of burial and decay experiments to track taphonomic change in modern contexts. These contexts can then be used to understand the taphonomic patterns seen in the fossil record (uniformitarianism at work; see Reitz and Wing 1999, 122–141).
An example of taphonomic study in action comes from Iron Age England (circa 750 B.C.E. to 43 C.E.). The Iron Age in southern England has a rich and diverse burial record. Since there is no universal or “normative” burial rite, taphonomic study is crucial to figuring out what cultural and ritual processes were operating at this time. Suddern Farm, an Iron Age site in Hampshire, England, includes a cemetery as well as isolated burials outside the cemetery and burials in ritual pits accompanied by the remains of feasting (King 2014, 187).
One of these pit burials, identified as P78, presents an interesting taphonomic case. He was a young adult male approximately 18–25 years old at the time of his death. His remains showed multiple sharp-force and penetrating wounds acquired around the time of his death. There were also carnivore tooth marks on the head of his right femur. These tooth marks provide an important taphonomic clue about how this individual was treated after death. P78 not only met a violent end, but his body was also allowed to lie exposed to the elements and animal scavengers before burial. If an individual is buried immediately, or protected prior to burial, animals do not have the opportunity to gnaw on the bones and flesh (Komar and Buikstra 2008, 196–200). Most Iron Age burials from this site were buried without exposure to scavengers, so P78 stood out as different. He was also buried in a pit when the majority of individuals at Suddern Farm were buried in the cemetery. He was not treated in the same way as the other dead in his community (King 2010, 136–139), and it is useful for us to consider why. P78 may represent a special ritual burial associated with violence or punishment. By better understanding the processes that occur in and to the body after death, we can reconstruct the cultural, biological, and geologic processes that affect remains.
Taphonomic analysis can also give us important insights into the development of complex thought and ritual in human evolution. In Chapter 11, you will see the first evidence of recognized burial practices in hominins. Taphonomy helped to establish whether these burials were simply the result of natural processes or intentionally constructed by humans (Klein 1999, 395; Straus 1989). Deliberate burials often include the body placed in a specific position, such as supine (on the back) with arms crossed over the chest or in a flexed position (think fetal position) facing a particular direction. If bones have evidence of a carnivore or rodent gnawing on them, it can be inferred that the remains were exposed to scavengers after death (as with P78 above). Going back further in time, taphonomic evidence may tell us how our ancestors died. For instance, several australopithecine fossils show evidence of carnivore tooth marks and even punctures from saber-toothed cats, indicating that we weren’t always the top of the food chain. The Bodo cranium, a Homo erectus cranium from Middle Awash Valley, Ethiopia, shows cut marks made by stone tools, indicating an early example of possible defleshing activity in our human ancestors (White 1986).
Preservation of Biological Remains
As we can only study the evidence that gets left behind in the fossil and archaeological record, preservation is a key topic in anthropological research. This chapter is concerned with the fossil record; however, there are other forms of preserved remains that provide anthropologists with information about the past. You’ve undoubtedly heard of mummification, likely in the context of Egyptian or South American mummies. However, bog bodies and ice mummies are further examples of how remains can be preserved in special circumstances. It is important to note that fossilization is a process that takes much longer than the preservation of bog bodies or mummies.
The most important element in the preservation of remains is a stable environment. This means that the organism should not be exposed to significant fluctuations in temperature, humidity, and weather patterns. Changes to moisture and temperature cause the organic tissues to expand and contract repeatedly, which will eventually cause microfractures and break down (Stodder 2008). Wetlands are a particularly good area for preservation because they allow for rapid permanent burial and a stable moisture environment. That is why many fossils are found in and around ancient lakes and river systems.
Bog bodies are good examples of wetland preservation. Peat bogs are formed by the slow accumulation of vegetation and silts in ponds and lakes. The conditions are naturally anaerobic (without oxygen). Much of the bacteria that causes decay is already present in our gut and can begin the decomposition process shortly after death during putrefaction (Booth et al. 2015). Since oxygen is necessary for the body’s bacteria to break down organic material, the decay process is significantly slowed or halted in anaerobic conditions. Throughout western Europe in the Bronze and Iron Ages, individuals were buried in these bogs. When they were found thousands of years later, they resembled recent burials. The hair, skin, clothing, and organs were exceptionally well preserved in addition to the bones and teeth (Eisenbeiss 2016; Ravn 2010). Preservation was so good in fact that archaeologists could identify the individuals’ last meals and re-create tattoos found on their skin.
Extreme cold can also halt the natural decay process. A well-known ice mummy is Otzi, a Copper Age man found in the Alps (Vidale et al. 2016). As with the bog bodies, his hair, skin, clothing, and organs were all well preserved. Recently, archaeologists were able to identify his last meal (Maixner et al. 2018). It was high in fat, a necessity when trying to survive in the extreme cold.
In the Andes, ancient peoples would bury human sacrifices throughout the high peaks in a sacred ritual called Capacocha (Wilson et al. 2007). The best-preserved mummy to date is called the “Maiden” or “Sarita” because she was found at the summit of Sara Sara Volcano. Her remains are over 500 years old, but she still looks like the 15-year-old girl she was at the time of her death, as if she had slept for 500 years. A Ripina Van Winkle, if you will (Reinhard 2006).
Finally, arid environments can also contribute to the preservation of organic remains. As discussed with waterlogged sites, much of the bacteria that is active in breaking down bodies is already present in our gut and begins the putrefaction process shortly after death. Arid environments deplete organic material of the moisture that putrefactive bacteria need to function (Booth et al. 2015). When that occurs, the soft tissue like skin, hair, and organs can be preserved. It is similar to the way a food dehydrator works to preserve meat, fruit, and vegetables for longterm storage. There are several examples of arid environments spontaneously preserving human remains, including catacomb burials in Austria and Italy (Aufderheide 2003, 170 and 192–205).
FOSSILIZATION
Though much of our knowledge about human evolution relies on evidence derived from fossils, it is important to realize that fossils only represent a tiny fraction of creatures that existed in the past. It would be impossible to calculate the exact amount, but the vast majority of animals that once lived do not make it into the fossil record. The reason for such a small number is that it is extremely difficult for an organism to become a fossil. There are many stages involved and if the process is disturbed at any of the stages, the organism will fail to become a fossil. After all, organisms are set up to deteriorate after we die. Bacteria, insects, scavengers, weather, and environment all aid in the process that breaks down organisms so their nutrients, molecules, and elements can be returned to Earth to maintain ecosystems (Stodder 2008). Fossilization, therefore, is the preservation of an organism against these natural decay processes (Figure 7.15).

For fossilization to occur, several important things must happen. First, the organism must be protected from things like bacterial activity, scavengers, and temperature and moisture fluctuations. Since soft tissue like organs, muscle, and skin are more easily broken down in the decay process, they are less likely to be preserved except in rare circumstances. Bones and teeth, however, last much longer and are more likely to be preserved in the fossil record (Williams 2004, 207).
The next important step in the fossilization process is sediment accumulation. The sediments cover and protect the organism from the environment. They, along with water, provide the minerals that will eventually become the fossil (Williams 2004, 31). Sediment accumulation also provides the pressure needed for mineralization to take place. Lithification is when the weight and pressure of the sediments squeeze out extra fluids and replace the voids, that appear in the remains as they decay, with minerals from the surrounding sediments. Finally, we have permineralization. This is when the organism is fully replaced by minerals from the sediments. A fossil is really a mineral copy of the original organism (Williams 2004, 31).
Types of Fossils
Plants
Plants make up the majority of fossilized materials. One of the most common plants existing today, the fern, has been found in fossilized form many times. Other plants that no longer exist or the early ancestors of modern plants come in fossilized forms as well. It is through these fossils that we can discover how plants evolved and learn about the climate of Earth over different periods of time.
Another type of fossilized plant is petrified wood. This fossil is created when actual pieces of wood—such as the trunk of a tree—mineralize and turn into rock. Petrified wood is a combination of silica, calcite, and quartz, and it is both heavy and brittle. Petrified wood can be colorful and is generally aesthetically pleasing because all the features of the original tree’s composition are illuminated through mineralization (Figure 7.16). There are a number of places all over the world where petrified wood “forests” can be found, but there is an excellent assemblage in Arizona, at the Petrified Forest National Park. At this site, evidence relating to the environment of the area some 225 mya is on display.

Human/Animal Remains

We are more familiar with the fossils of early animals because natural history museums have exhibits of dinosaurs and prehistoric mammals. However, there are a number of fossilized hominin remains that provide a picture of the fossil record over the course of our evolution from primates. The term hominins includes all human ancestors who existed after the evolutionary split from chimpanzees and bonobos, some six to seven mya. Modern humans are Homo sapiens, but hominins can include much earlier versions of humans. One such hominin is “Lucy” (AL 288-1), the 3.2 million-year-old fossil of Australopithecus afarensis that was discovered in Ethiopia in 1974 (Figure 7.17). Until recently, Lucy was the most complete and oldest hominin fossil, with 40% of her skeleton preserved (see Chapter 9 for more information about Lucy). In 1994, an Australopithecus fossil nicknamed “Little Foot” (Stw 573) was located in the World Heritage Site at Sterkfontein Caves (“the Cradle of Humankind”) in South Africa. Little Foot is more complete than Lucy and possibly the oldest fossil that has so far been found, dating to at least 3.6 million years (Granger et al. 2015). Through tedious excavation, the specific ankle bones of the fossil were extricated from the matrix of concrete-like rock, revealing that the bones of the ankles and feet indicate bipedalism (University of Witwatersrand 2017).
Both the Lucy and Little Foot fossils date back to the Pliocene (5.8 to 2.3 mya). Older hominin fossils from the late Miocene (7.25 to 5.5 mya) have been located, although they are much less complete. The oldest hominin fossil is a fragmentary skull named Sahelanthropus tchadensis, found in Northern Chad and dating to circa seven mya (Lebatard et al. 2008).
The fossils of animals can be simple or complex, from worms to mammals. The fossils of primates provide information regarding the backstory of humankind. It is through the discovery, dating, and study of primate and early hominin fossils that we find physical evidence of the evolutionary timeline of humans. Without a complete cranium (or other fossilized remains), it is difficult to tell exactly what was going on in the fossil record. Only a small number of living things will ever become fossilized. Furthermore, it is reasonable to assume that of the existing fossilized remains, many remain hidden in glaciated rock, in caves, or in the ground. (See “Special Topic: Cold Case Naia” for a particularly interesting cave discovery.)
Amber


Amber is the fossilized sap of coniferous trees. Sometimes pieces of amber contain inclusions such as air bubbles or insects that become trapped in the sap (Figure 7.18). This beautiful fossil comes in a variety of colors from light gold to orange red to even green. For this reason, amber is frequently polished to a high luster and used in jewelry (Figure 7.19). Raw Baltic amber is also known as succinite and can be over 40 million years old. It comes from the cold Baltic region of northern Europe. Baltic amber is often worn for pain relief by teething infants or individuals with arthritis because succinic acid is released when warmed by body heat. The notoriety of amber increased significantly when it was featured in the highly fictionalized Jurassic Park film franchise. In the film, they were able to extract dinosaur DNA from the blood inside a fossilized mosquito. Rest assured, at the time of this writing, amber is not being used as the genetic basis for the regeneration of extinct dinosaurs, although the recent discovery of a tick that fed off of dinosaur blood that is trapped in amber has renewed interest in the idea (Pickrell 2017).
Asphalt

Asphalt, a form of crude oil, can also yield fossilized remains. Asphalt is commonly referred to in error as tar because of its viscous nature and dark color. A famous fossil site from California is La Brea Tar Pits in downtown Los Angeles (Figure 7.20). In the middle of the busy city on Wilshire Boulevard, asphalt (not tar) bubbles up through seeps (cracks) in the sidewalk. The La Brea Tar Pits Museum provides an incredible look at the both extinct and extant animals that lived in the Los Angeles Basin 40,000–11,000 years ago. These animals became entrapped in the asphalt during the Pleistocene and perished in place. Even today, in several directions from the museum, small invertebrates such as worms and insects are still being entrapped as the asphalt seeps up from the ground. Ongoing excavations have yielded millions of fossils, including megafauna such as American mastodons and incomplete skeletons of extinct species of dire wolves, Canis dirus, and the saber-toothed cat, Smilodon fatalis (Figures 7.21 and 7.22). Fossilized remains of plants have also been found in the asphalt. Between the fossils of animals and those of plants, paleontologists have a good idea of the way the Los Angeles Basin looked and the climate in the area many thousands of years ago.


Igneous Rock
Most fossils are found in sedimentary rock. This type of rock that has been formed from deposits of minerals over millions of years in bodies of water on Earth’s surface. Some examples include shale, limestone, and siltstone. Sedimentary rock typically has a layered appearance. However, fossils have been found in igneous rock as well. Igneous rock is volcanic rock that is created from cooled molten lava. It is rare for fossils to survive molten lava, and it is estimated that only 2% of all fossils have been found in igneous rock (Ingber 2012). Part of a giant rhinocerotid skull dating back 9.2 mya to the Miocene was discovered in Cappadocia, Turkey, in 2010. The fossil was a remarkable find because the eruption of the Çardak caldera was so sudden that it simply dehydrated and “baked” the animal (Antoine et al. 2012).
Trace Fossils
Depending on the specific circumstances of weather and time, even footprints can become fossilized. Footprints fall into the category of trace fossils, which includes other evidence of biological activity such as nests, burrows, tooth marks, shells. When you consider how quickly our footprints on the ground or in sand disappear, you must also realize how rare it is that footprints can become fossilized. A well-known example of trace fossils are the Laetoli footprints in Tanzania (Figure 7.23). (You can read more about the Laetoli footprints in the Special Topics box at the end of this section.)

Other fossilized footprints have been discovered around the world. At Pech Merle cave in the Dordogne region of France, archaeologists discovered two fossilized footprints. They then brought in indigenous trackers from Namibia to look for other footprints. The approach worked as many other footprints belonging to as many as five individuals were discovered with the expert eyes of the trackers (Pastoors et al. 2017). These footprints date back 12,000 years (Granger Historical Picture Archive 2018).
Some of the more unappealing but fascinating trace fossils are bezoars and coprolite. Mary Anning found bezoars, or hard, concrete-like substances in the intestines of fossilized creatures. Bezoars start off like the hair balls that cats and rabbits accumulate from grooming but become hard, concrete-like substances in the intestines. If an animal with a hairball dies before expelling the hair ball mass and the organism becomes fossilized, that mass becomes a bezoar. You may remember that in the Harry Potter books, Professor Snape discusses bezoars on the first day of Potions Class (Rowling 1998, p. 137). Later, the bezoar is crucial in saving Ron Weasley when he’s poisoned (Rowling 2005, p. 398).

Anning also found coprolite, or fossilized dung. The Dean of Westminster, geologist and paleontologist William Buckland (1784–1856), first recognized the value of coprolite, but it was Anning who provided him with specimens. One of the best collections of coprolites is affectionately known as the “Poozeum.” The collection includes a huge coprolite named “Precious” (Figure 7.24). Coprolite, like all fossilized materials, can be in matrix—meaning that the fossil is embedded in secondary rock. As unpleasant as it may seem to work with coprolites, remember that the organic material in dung has mineralized or has started to mineralize; therefore, it is no longer soft and is generally not smelly. Also, just as a doctor can tell a lot about health and diet from a stool sample, anthropologists can glean a great deal of information from coprolite about the diets of ancient animals and the environment in which the food sources existed. For instance, 65 million-year-old grass phytoliths (microscopic silica in plants) found in dinosaur coprolite in India revealed that grasses had been in existence much earlier than scientists initially believed (Taylor and O’Dea 2014, 133).
Pseudofossils
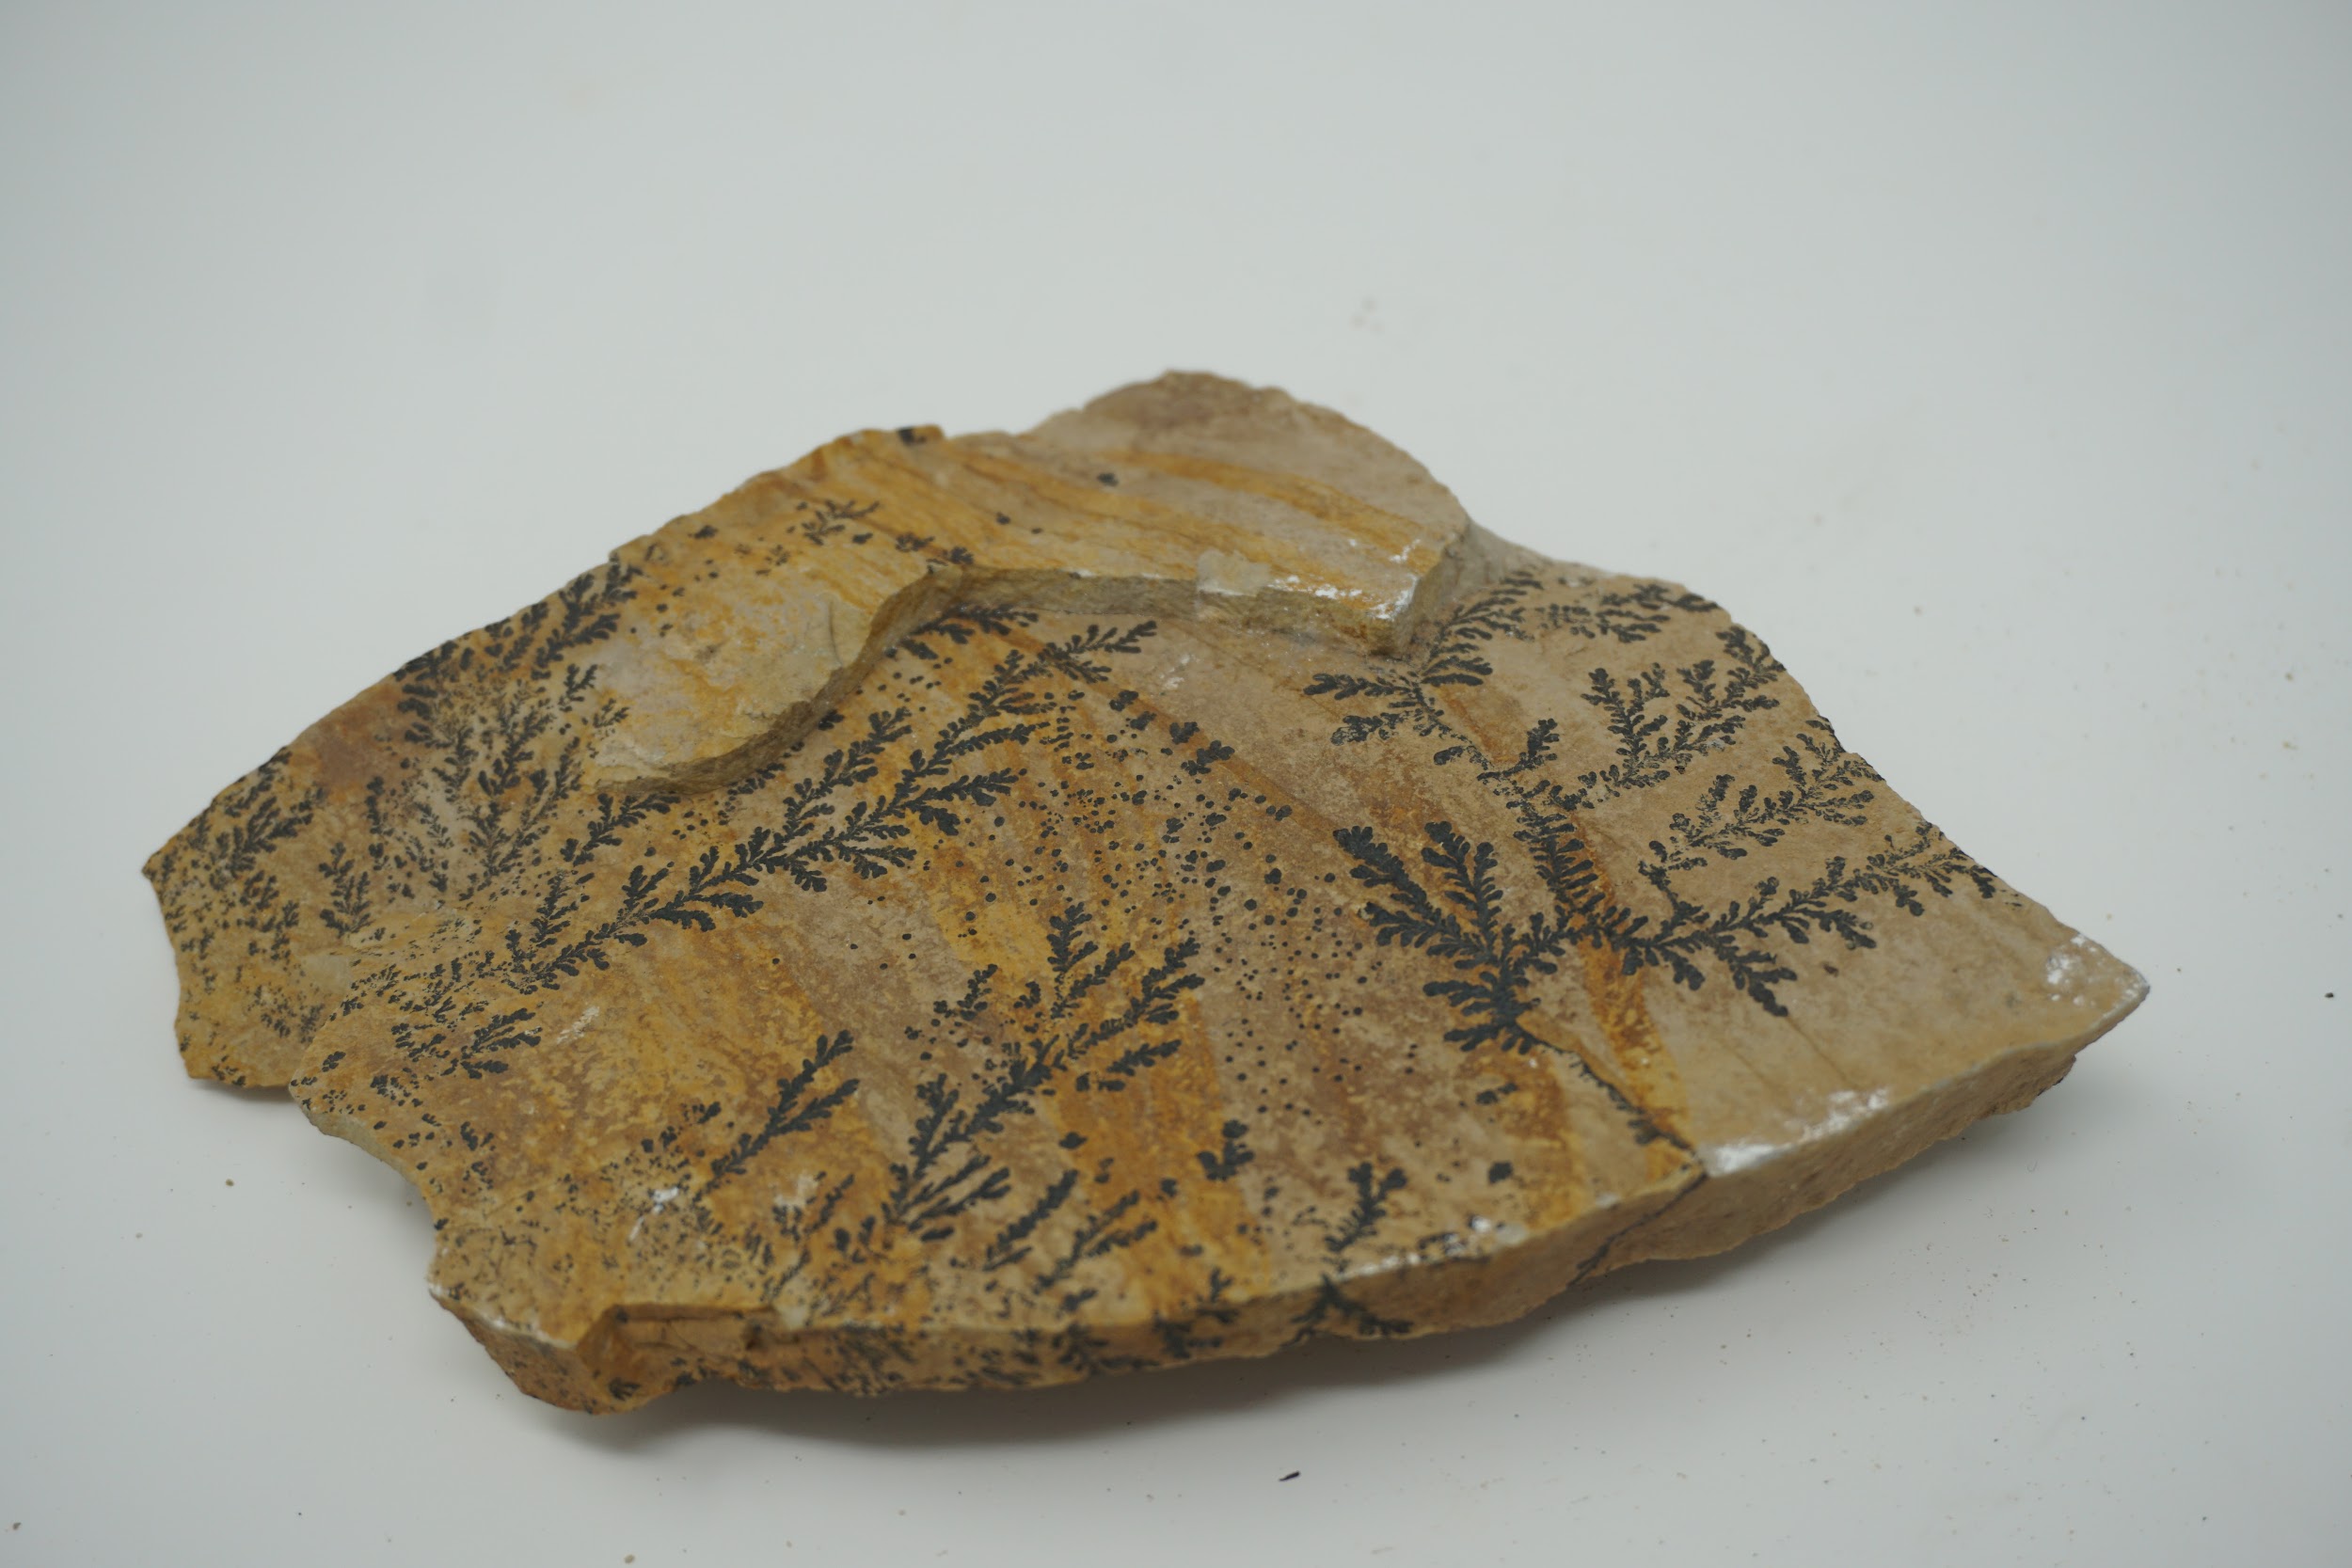
Pseudofossils are not to be mistaken for fake fossils, which have vexed scientists from time to time. A fake fossil is an item that is deliberately manipulated or manufactured to mislead scientists and the general public. In contrast, pseudofossils are not misrepresentations but rather misinterpretations of rocks that look like true fossilized remains (S. Brubaker, personal communication, March 9, 2018). Pseudofossils are the result of impressions or markings on rock, or even the way other inorganic materials react with the rock. A common example is dendrites, the crystallized deposits of black minerals that resemble plant growth (Figure 7.25). Other examples of pseudofossils are unusual or odd-shaped rocks that include various concretions and nodules. An expert can examine a potential fossil to see if there is the requisite internal structure of organic material such as bone or wood that would qualify the item as a fossil.
SPECIAL TOPIC: LAETOLI FOOTPRINTS

In 1974, British anthropologist Mary Leakey discovered fossilized animal tracks at Laetoli (Figure 7.26), not far from the important paleoanthropological site at Olduvai Gorge in Tanzania. A few years later, a 27 meter trail of hominin footprints were discovered at the same site. These 70 footprints, now referred to as the Laetoli Footprints, were created when early humans walked in wet volcanic ash. Before the impressions were obscured, more volcanic ash and rain fell, sealing the footprints. These series of environmental events were truly extraordinary, but they fortunately resulted in some of the most famous and revealing trace fossils ever found. Dating of the footprints indicate that they were made 3.6 mya (Smithsonian National Museum of Natural History 2018).
Just as forensic scientists can use footprints to identify the approximate build of a potential suspect in a crime, archaeologists have read the Laetoli Footprints for clues to this early human. The footprints clearly indicate a bipedal hominin who had a foot similar to that of modern humans. Analysis of the gait through computer simulation revealed that the hominins at Laetoli walked similarly to the way we walk today (Crompton 2012). More recent analyses confirm the similarity to modern humans but also indicate that their gait involved more of a flexed limb than that of modern humans (Hatala et al. 2016; Raichlen and Gordon 2017). The relatively short stride implies that the hominin had short legs—unlike the longer legs of later early humans who migrated out of Africa (Smithsonian National Museum of History 2018; see Figure 7.27). In the context of Olduvai Gorge, where fossils of Australopithecus afarensis have been located and dated to the same timeframe as the footprints, it is likely that these newly discovered impressions were left by this same hominin.
The footprints at Laetoli were made by a small group of as many as three Australopithecus afarensis, walking in close proximity, not unlike what we would see on a modern street or sidewalk. Two trails of footprints have been positively identified with one set of the prints indicating that the individual was carrying something on one side. The third set of prints are much smaller and seem to appear in the tracks left by one of the larger individuals. While scientific methods have given us the ability to date the footprints and understand the body mechanics of the hominin, additional consideration of the footprints can lead to other implications. For instance, the close proximity of the individuals implies a close relationship existed between them, not unlike that of a family. Due to the size variation and the depth of impression, the footprints seem to have been made by two larger adults and possibly one child. Scientists theorize that the weight being carried by one of the larger individuals is a young child or a baby (Masao et al. 2016). Excavation continues at Laetoli today, resulting in the discovery of two more footprints in 2015, also believed to have been made by Au. afarensis (Masao et al. 2016).
VOICES FROM THE PAST: WHAT FOSSILS CAN TELL US
Given that so few organisms ever become fossilized, any anthropologist or fossil hunter will tell you that finding a fossil is extremely exciting. But this is just the beginning of a fantastic mystery. With the creative application of scientific methods and deductive reasoning, a great deal can be learned about the fossilized organism and the environment in which it lived, leading to enhanced understanding of the world around us.
Dating Methods
Context is a crucial concept in paleoanthropology and archaeology. Objects and fossils are interesting in and of themselves, but without context there is only so much we can learn from them. One of the most important contextual pieces is the dating of an object or fossil. By being able to place it in time, we can compare it more accurately with other contemporary fossils and artifacts or we can better analyze the evolution of a fossil species or artifacts. To answer the question “How do we know what we know?” you have to know how archaeologists and paleoanthropologists establish dates for artifacts, fossils, and sites.
Dating techniques are divided into two broad categories: relative dating methods and chronometric (sometimes called absolute) dating methods.
Relative Dating
Relative dating methods are the first used because they rely on simple observational skills. In the 1820s, Christian Jürgensen Thomsen at the National Museum of Denmark in Copenhagen developed the “three-age” system still used in European prehistory today (Feder 2017, 17). He categorized the artifacts at the museum based on the idea that simpler tools and materials were most likely older than more complex tools and materials. Stone tools must predate metal tools because they do not require special technology to develop. Copper and bronze tools must predate iron because they can be smelted or worked at lower temperatures, etc. Based on these observations, he categorized the artifacts into Stone Age, Bronze Age, and Iron Age.
The restriction of relative dating is that you don’t know specific dates or how much time passed between different sites or artifacts. You simply know that one artifact or fossil is older than another. Thomsen knew that Stone Age artifacts were older than Bronze Age artifacts, but he couldn’t tell if they were hundreds of years older or thousands of years older. The same is true with fossils that have differences of ages into the hundreds of millions of years.
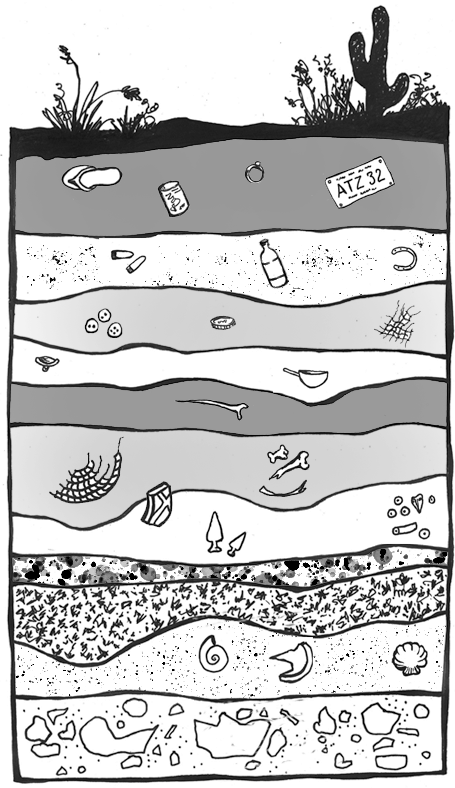
The first relative dating technique is stratigraphy (Figure 7.28). You might have already heard this term if you have watched documentaries on archaeological excavations. That’s because it is still being used today. It provides a solid foundation for other dating techniques to be used and gives important context to artifacts and fossils found at a site.
Stratigraphy is based on the Law of Superposition first proposed by Nicholas Steno in 1669 and further explored by James Hutton (the previously mentioned “Father” of Deep Time). Essentially, superposition tells us that things on the bottom are older than things on the top (Williams 2004, 28). Notice on Figure 7.28 that there are distinctive layers piled on top of each other. It stands to reason that each layer is older than the one immediately on top of it (Hester et al. 1997, 338). Think of a pile of laundry on the floor. Over the course of a week, as dirty clothes get tossed on that pile, the shirt tossed down on Monday will be at the bottom of the pile while the shirt tossed down on Friday will be at the top. Assuming that the laundry pile was undisturbed throughout the week, if the clothes were picked up layer by layer, the clothing choices that week could be reconstructed in the order that they were worn. This concept may seem simple or even obvious, but it is extremely important in archaeology.
Another important relative dating technique is biostratigraphy. This form of dating looks at the context of a fossil or artifact and compares it to the other fossils and biological remains (plant and animal) found in the same stratigraphic layers. For instance, if an artifact is found in the same layer as wooly mammoth remains, you know that it must date to around the last ice age, when wooly mammoths were still abundant on Earth. In the absence of more specific dating techniques, early archaeologists could prove the great antiquity of stone tools because of their association with extinct animals. The application of this relative dating technique in archaeology was used at the Folsom site in New Mexico. Ever since Europeans encountered people in the Americas, they wondered how long they had been on the continent. Were they recent arrivals from Asia or had their ancestors been there thousands of years? Biostratigraphy helped answer this question before absolute dating techniques had even been invented. In 1927, at a site in Folsom, New Mexico, a stone spear point was discovered embedded in the rib of an extinct species of bison. Because of the undeniable association between the artifact and the ancient animal, there was proof that people had occupied the North American continent since antiquity (Cook 1928).

Similar to biostratigraphic dating is cultural dating (Figure 7.29). This relative dating technique is used to identify the chronological relationships between human-made artifacts. Cultural dating is based on artifact types and styles (Hester et al. 1997, 338). For instance, a pocket knife by itself is difficult to date. However, if the same pocket knife is discovered surrounded by cassette tapes and VHS tapes, it is logical to assume that the artifact came from the 1980s or 1990s like the cassette and VHS tapes. The pocket knife could not be dated earlier than the age of the cassette and VHS tapes because the tapes were made no earlier than the 1980s. In the Thomsen example above, he was able to identify a relative chronology of ancient European tools based on the artifact styles, manufacturing techniques, and raw materials. Cultural dating can be used with any human-made artifacts. Both cultural dating and biostratigraphy are most effective when you are already familiar with the time periods for the artifacts and animals. They are still used today to identify general time periods for sites.
Chemical dating was developed in the 19th century and represents one of the early attempts to use soil composition and chemistry to date artifacts. A specific type of chemical dating is fluorine dating, and it is commonly used to compare the age of the soil around artifacts located in close proximity (Cook and Ezra-Cohn 1959). While this technique is based on chemical dating, it only provides the relative dates of items rather than their absolute ages. For this reason, fluorine dating is considered a hybrid form of relative and chronometric dating methods (discussed below).
Soils contain different amounts of chemicals, and those chemicals, such as fluorine, can be absorbed by human and animal bones buried in the soil. The longer the remains are in the soil, the more fluorine they will absorb (Cook and Ezra-Cohn 1959). Unfortunately, this absorption rate is highly sensitive to temperature, soil pH, and varying fluorine levels in local soil and groundwater (Haddy and Hanson 1982). This makes it difficult to get an accurate date for the remains or to compare remains between two sites. However, this technique is particularly useful for determining whether different artifacts come from the same burial context. If they were buried in the same soil for the same length of time, their fluorine signatures would match.

The fluorine technique was used to identify the famous archaeological forgery,“Piltdown Man” (Figure 7.30). In 1912, Charles Dawson of England “discovered” Piltdown Man, or Eoanthropus dawsoni. In addition to bringing worldwide attention to British anthropology, Dawson himself became famous for his discovery. As a fossil specimen, Piltdown Man had a large bulbous cranium like modern humans, but a primitive apelike jaw and teeth. These characteristics helped Dawson convince many in the field of anthropology that his fossil was the “missing link” between apes and humans. Dawson’s find also served as incontrovertible evidence for a European origin of human evolution, a hypothesis that favored Western-imposed thought and superiority. Because Dawson’s discovery was accepted for over 40 years, many researchers became skeptical of the newer finds coming out of South Africa that did not share the same unique characteristics as Eoanthropus (De Groote et al. 2016). However, as more and more of the human African fossils began emerging, scientists began to suspect Piltdown Man was not the missing link as it had been represented and the credibility of Eoanthropus was brought into scrutiny.
It was not until after Dawson’s death that outside researchers were able to access the remains and conduct independent analysis on them. They noticed that the teeth had odd wear patterns on them. Dawson had filed them down to better fit the mandible to the maxilla. Fluorine analysis determined that the jaw and cranium had different fluorine signatures. Thus, these bones could not have come from the same individual in the same burial environment. It turned out that the cranium was from two, maybe three, medieval humans and the jaw from a modern Bornean orangutan, Pongo pygmaeus (De Groote et al. 2016). Furthermore, all of the pieces of the cranium were stained to give a uniform and ancient-looking color. Piltdown Man was a forgery that greatly disrupted legitimate anthropological research and confused the understanding of the fossil record in the early 20th century.
Chronometric Dating
Unlike relative dating methods, chronometric dating methods provide specific dates and time ranges. Many of the chronometric techniques we will discuss are based on work in other disciplines such as chemistry and physics. The modern developments in studying radioactive materials are extremely accurate and precise in establishing dates for ancient sites and remains.

Many of the chronometric dating methods are based on the measurement of radioactive decay of particular elements. Elements are materials that cannot be broken down into more simple materials without losing their chemical identity (Brown et al. 2018, 48). Each element consists of an atom that has a specific number of protons (positively charged particles) and electrons (negatively charged particles) as well as varying numbers of neutrons (particles with no charge). The protons and neutrons are located in the densely compacted nucleus of the atom, but the majority of the volume of an atom is space outside the nucleus around which the electrons orbit (see Figure 7.31).
Elements are classified based on the number of protons in the nucleus. For example, carbon has six protons, giving it an atomic number 6. Uranium has 92 protons, which means that it has an atomic number 92. While the number of protons in the atom of an element do not vary, the number of neutrons may. Atoms of a given element that have different numbers of neutrons are known as isotopes.
The majority of an atom’s mass is determined by the protons and neutrons, which have more than a thousand times the mass of an electron. Due to the different numbers of neutrons in the nucleus, isotopes vary by nuclear/atomic weight (Brown et al. 2018, 94). For instance, isotopes of carbon include carbon 12 (12C), carbon 13 (13C), and carbon 14 (14C). Carbon always has six protons, but 12C has six neutrons whereas 14C has eight neutrons. Because 14C has more neutrons, it has a greater mass than 12C (Brown et al. 2018, 95).
Most isotopes in nature are considered stable isotopes and will remain in their normal structure indefinitely. However, some isotopes are considered unstable isotopes (sometimes called radioisotopes) because they spontaneously release energy and particles, transforming into stable isotopes (Brown et al. 2018, 946; Flowers et al. 2018, section 21.1). The process of transforming the atom by spontaneously releasing energy is called radioactive decay. This change occurs at a predictable rate for nearly all radioisotopes of elements, allowing scientists to use unstable isotopes to measure time passage from a few hundred to a few billion years with a large degree of accuracy and precision.
The leading chronometric method for archaeology is radiocarbon dating (Figure 7.32). This method is based on the decay of 14C, which is an unstable isotope of carbon. It is created when nitrogen 14 (14N) interacts with cosmic rays, which causes it to convert to 14C. Carbon 14 in our atmosphere is absorbed by plants during photosynthesis, a process by which light energy is turned into chemical energy to sustain life in plants, algae, and some bacteria. Plants absorb carbon dioxide from the atmosphere and use the energy from light to convert it into sugar that fuels the plant (Campbell and Reece 2005, 181–200). Though 14C is an unstable isotope, plants can use it in the same way that they use the stable isotopes of carbon.

Animals get the 14C by eating the plants. Humans take it in by eating plants and animals. Carbon 14 has a half-life of 5,730 years (Hester et al. 1997, 324). That means that in 5,730 years, half the amount of 14C will have converted back into 14N. Because the pattern of radioactive decay is so reliable, we can use 14C to accurately date sites up to 50,000 years old. However, 14C can only be used on the remains of biological organisms. This includes shell, wood, plant material, and bone.
As mentioned before, 14C is unstable and ultimately decays back into 14N. This decay is happening at a constant rate (even now inside your own body!). However, as long as an organism is alive and taking in food, 14C is being replenished in the body. As soon as an organism dies, it no longer takes in new 14C. We can then use the rate of decay to measure how long it has been since the organism died (Hester et al. 1997, 324).
An example of this is the use of 14C to date burials. For instance, at the Iron Age site of Wetwang Slack in East Yorkshire, England, a selection of burials across the site were dated directly with 14C. By choosing a range of burials, archaeologists were able to identify the length of time the cemetery was used as well as different phases of use (Dent 1982). Because we can assume that any artifacts found with the bodies were placed there at the time of burial, we can estimate the age of the artifacts even though the bones were the only things directly dated.
As you will see in the hominin chapters, 50,000 years is only a tiny fragment of human evolutionary history. It is insignificant in the context of the age of our planet. In order to date even older fossils, other methods of dating are necessary. Some of these are also based on radioactive decay.
Potassium-argon (K-Ar) dating and argon-argon (Ar-Ar) dating can reach further back into the past than radiocarbon dating. Used to date volcanic rock, these techniques are based on the decay of unstable potassium 40 (40K) into argon 40 (40Ar) gas, which gets trapped in the crystalline structures of volcanic material. It’s important to note that this form of dating is not done directly on the fossil in which you are interested. This is where stratigraphy becomes important. The K-Ar method dates the layers around the fossil to give approximate dates for when that fossil was deposited. The benefit of this dating technique is that 40K has a half-life of circa 1.3 billion years, so it can be used on sites as young as 100 kya and as old as the age of Earth. As you will see in later chapters, it is particularly useful in dating early hominin sites in Africa (Michels 1972, 120; Renfrew and Bahn 2016, 155).

Fission track dating is another useful dating technique for sites that are millions of years old. This is based on the decay of radioactive uranium 238 (238U). The unstable atom of 238U fissions at a predictable rate. The fission takes a lot of energy and causes damage to the surrounding rock (see Figure 7.33). For instance, in volcanic glasses we can see this damage as trails in the glass. Researchers in the lab count the number of fission trails using an optical microscope. As 238U has a half-life of 4,500 million years, it can be used to date rock and mineral material starting at just a few decades and extending back to the age of Earth. As with K-Ar, archaeologists are not dating artifacts directly. They are dating the layers around the artifacts in which they are interested (Laurenzi et al. 2007).
Luminescence dating, which includes thermoluminescence and a related technique called optically stimulated luminescence, is based on the naturally occurring background radiation in soils. Pottery, baked clay, and sediments that include quartz and feldspar are bombarded by radiation from the soils surrounding it. Electrons in the material get displaced from their orbit and trapped in the crystalline structure of the pottery, rock, or sediment. When heated to 500°C (thermoluminescence) or exposed to particular light wavelengths (optically stimulated luminescence) in the laboratory, this energy gets released in the form of light and heat and can be measured (Cochrane et al. 2013; Renfrew and Bahn 2016, 160). You can use this method to date artifacts like pottery and burnt flint directly. When attempting to date fossils, you may use this method on the crystalline grains of quartz and feldspar in the surrounding soils (Cochrane et al. 2013). The important thing to remember with this form of dating is that heating the artifact or soils will reset the clock. The method is not necessarily dating when the object was last made or used but when it was last heated to 500°C or more (pottery) or exposed to sunlight (sediments). Luminescence dating can be used on sites from less than 100 years to over 100,000 years (Duller 2008, 4). As with all archaeological data, context is crucial to understanding the information.
Like thermoluminescence dating, electron spin resonance dating is based on the measurement of accumulated background radiation from the burial environment. It is used on artifacts and rocks with crystalline structures, including tooth enamel, shell, and rock—those for which thermoluminescence would not work. The radiation causes electrons to become dislodged from their normal orbit. They become trapped in the crystalline matrix and affect the electromagnetic energy of the object. This energy can be measured and used to estimate the length of time in the burial environment. This technique works well for remains as old as two million years (Carvajal et al. 2011, 115–116). It has the added benefit of being nondestructive, which is an important consideration when dealing with irreplaceable material.
Not all chronometric dating methods are based on unstable isotopes and their rates of decay. There are several other methods that make use of other natural biological and geologic processes. One such method is known as dendrochronology (Figure 7.34). It is based on the natural growth patterns of trees. As most of you probably learned in elementary school, trees create concentric rings as they grow. The width of those rings depends on environmental conditions and season. In a perfect world, you can tell the age of a tree by counting the rings. You can also see a record of rainfall, droughts, and forest fires using the rings.
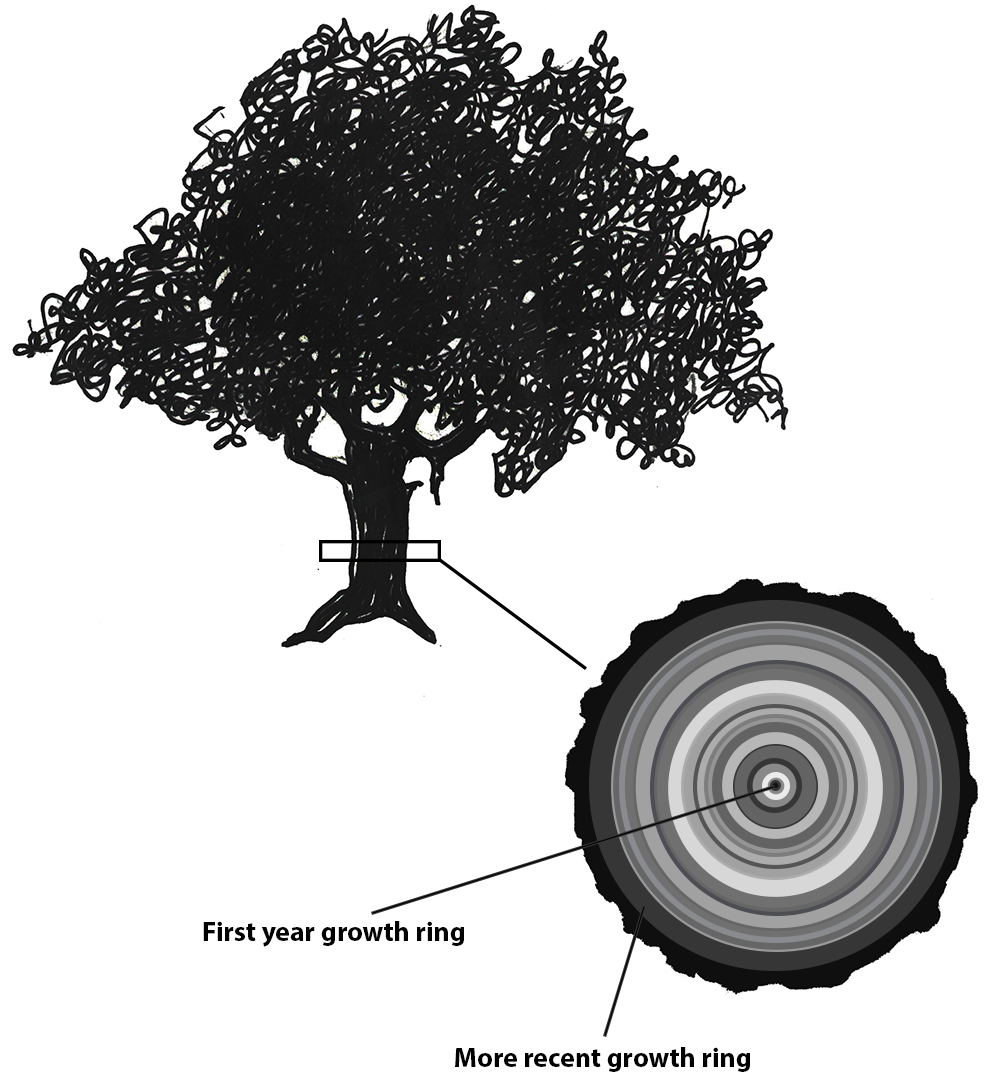

Figure 7.34 Dendrochronology uses the variations in tree rings to create timelines.
Tree rings can be used to date wood artifacts from ancient sites. First, archaeologists need to create a profile of trees in a particular area. They start with modern trees and identify patterns in ring growth. Then, they overlap these patterns with slightly older trees to extend the timeline back. These tree patterns can be overlapped back in time as long as there are intact tree rings available. The Northern Hemisphere chronology stretches backs nearly 14,000 years (Reimer et al. 2013, 1870). Archaeologists can then compare wood artifacts with existing timelines and find where their artifacts fit in the pattern.
This method, however, is not foolproof. Growth can be interrupted so that tree rings do not correspond exactly with the tree’s age. Microclimates and tree species variation can also alter growth patterns. However, dendrochronologists can work around these issues using multiple samples, statistical analysis, and calibration with other dating methods. Additionally, for this method to work, the artifact must be preserved well enough to have visible tree rings to analyze. The results of the analysis will tell you an approximate time that the tree lived. To know exactly when the tree was cut down, the outer rings and bark should be present. But despite these limitations, dendrochronology can be a powerful tool in dating archaeological sites (Hillam et al. 1990; Kuniholm and Striker 1987).
Dendrochronology has been in use since the early 20th century (Dean 2009, 25). It has been used successfully to date southwestern U.S. sites such as Pueblo Bonito and Aztec Ruin (Dean 2009, 26). In Europe during the mid-20th century, archaeologists built chronologies that spanned thousands of years. The dendrochronological evidence helped calibrate radiocarbon dates and even provided direct evidence of global warming (Dean 2009, 26–27).
Amino acid racemization (AAR) is a dating method that is used for organic materials such as bones, teeth, and shell. Organic tissues include amino acids that help build their structures. The molecular structure of amino acids occurs in two forms (isomers), “D (dextrorotatory) and L (levorotatory) forms” (Komutrattananont and Mahakkanukrauh 2017). These forms (referred to as enantiomers) have molecular structures that are mirror images of each other under polarized light. During life, most amino acids are in the L-form. However, upon the death of an organism the amino acids flip to the mirror image or D-form. This switch happens at a predictable rate and, like radiocarbon dating, can be a useful measure of time elapsed since the organism’s death. Its usable time range extends well beyond that of radiocarbon dating and can be used on remains over a million years old (Renfrew and Bahn 2016, 163). However, AAR is sensitive to temperature, so it is important know the relative temperature fluctuations of the site or the results will not be reliable.

Finally, we have paleomagnetic/geomagnetic reversals. This is a fairly easy concept, but it takes a bit of explanation because it is easy to confuse geographic positions with geomagnetism. Most people are aware that the North Pole occurs at the Arctic Circle and the South Pole occurs at the Antarctic Circle. The typical classroom globe reinforces this concept because it typically has a rod inserted through the middle of the sphere that attaches the globe to its stand (Figure 7.35). The rod is an imaginary axis on which Earth supposedly spins, and because it enters the globe at Latitude 90° N., this point is called Geographic North. The coordinates for the south pole are just the opposite or 90° S., Geographic South.
However, for planet Earth, the poles are actually magnetic fields, and geomagnetic poles are not located at the same places as geographic poles. Just to complicate the matter, magnetic poles move around. Fortunately, scientists have been able to chart these movements since 1899. According to Randy Russell (2007), in the early 20th century, there was about 9 km of movement per year. However, by 1970, the movement sped up significantly, to 41 km per year. The impact of human activity with global warming and the melting of glacial mass loss continues to speed up this movement (Adhikari and Ivins 2016). Eventually, the geomagnetic north and south poles will swap, an event called a paleomagnetic or geomagnetic reversal. As radical as that seems, it’s important to remember that these reversals have occurred many times, typically every couple of hundreds of thousands of years over the course of long history of the earth. Obviously, there are implications to reversal. The clearest is that compasses will not work as expected. Animals may become disoriented, at least at first (Drake 2018). Furthermore, some scientists predict an increase in solar flares that will create holes in the ozone layer, likely resulting in increased instances of skin cancer and interference with satellite technology (Valet and Valladas 2010; Wolchover 2012). But it is not all bad news. The beautiful green and purple skies created by the aurora borealis or “Northern Lights” will be increasingly visible at southern latitudes as the geomagnetic reversal progresses (Drake 2018). However, there is a great deal of debate regarding impacts of geomagnetic reversals on the planet and studies are ongoing.
When the poles do reverse, we can identify it in the geologic record by analyzing volcanic rock. Iron minerals in volcanic material align themselves with the poles’ positions at the time the volcanic material is still molten. When the material cools and hardens, those minerals are locked into place. They give us a glimpse of the poles’ locations at the time the rock cooled (Gubbins 2008). These events can be correlated with other dating methods and are used to identify broad time periods (sometimes lasting tens to hundreds of thousands of years) of particular layers of interest.
Environmental Reconstruction
Another important part of understanding human evolution (and evolution in general) is understanding the way in which an organism’s environment affects its survival. As you read in chapter 2, Darwin, Lamarck, Wallace, and others recognized the importance of the environment in shaping the evolutionary course of animal species. To understand what selective processes might be shaping evolutionary change, we must be able to reconstruct the environment in which the organism was living.
One of the ways to do that is to look at the plant species that lived in the same time range as the species in which you are interested. One way to identify ancient flora is to analyze sediment cores from water and other protected sources. Pollen gets released into the air and some of that pollen will fall on wetlands, lakes, caves, and so forth. Eventually it sinks to the bottom of the lake and forms part of the sediment. This happens year after year, so subsequent layers of pollen build up in an area, creating strata. By taking a core sample and analyzing the pollen and other organic material, an archaeologist can build a timeline of plant types and see changes in the vegetation of the area (Hester et al. 1997, 284). This can even be done over large areas by studying ocean bed cores, which accumulate pollen and dust from large swaths of neighboring continents.
Another way of reconstructing past environments is by using stable isotopes. Unlike unstable isotopes, stable isotopes remain constant in the environment throughout time. Plants take in the isotopes through photosynthesis and ground water absorption. Animals take in isotopes by drinking local water and eating plants. Stable isotopes can be powerful tools for identifying where an organism grew up and what kind of food the organism ate throughout its life. They can even be used to identify global temperature fluctuations.
Global Temperature Reconstruction

Oxygen isotopes are a powerful tool in tracking global temperature fluctuations throughout time. The isotopes of Oxygen 18 (18O) and Oxygen 16 (16O) occur naturally in Earth’s water. Both are stable isotopes, but 18O has a heavier atomic weight. In the normal water cycle, evaporation takes water molecules from the surface to the atmosphere. Because 16O is lighter, it is more likely to be part of this evaporation process. The moisture gathers in the atmosphere as clouds that eventually may produce rain or snow and release the water back to the surface of the planet. During cool periods like glacial periods (ice ages), the evaporated water often comes down to Earth’s surface as snow. During these periods, snow piles up in the winter but, because of the cooler summers, does not melt off. Instead, the snow gets compacted and layered year after year, eventually resulting in large glaciers or ice sheets covering parts of Earth. Since 16O, with the lighter atomic weight, is more likely to be absorbed in the evaporation process, it gets locked up in glacier formation. The waters left in oceans would have a higher ratio of 18O during these periods of cooler global temperatures (Potts 2012, 154–156; see Figure 7.36).
The microorganisms that live in the oceans, foraminifera, absorb the water from their environment and use the oxygen isotopes in their body structures. When these organisms die, they sink to the ocean floor, contributing to the layers of sediment. Scientists can extract these ocean cores and sample the remains of foraminifera for their 18O and 16O ratios. These ratios will give a good approximation of global temperatures deep into the past. Cooler temperatures indicate higher ratios of 18O (Potts 2012, 154–156).
Diet Reconstruction
Stable isotopes can also be used to reconstruct animal diet and migration patterns. The concept is “you are what you eat.” Living organisms absorb elements from ingested plants and water. These elements are used in tissues like bones, teeth, skin, hair, and so on. By analyzing the stable isotopes in the bones and teeth of humans and other animals, we can identify the types of food they ate at different stages of their lives as well as where they lived.
Plants take in carbon dioxide from the atmosphere during photosynthesis. We’ve already discussed this using the example of the unstable isotope 14C; however, this absorption also takes place with the stable isotopes of 12C and 13C. During photosynthesis, some plants incorporate carbon dioxide as a three-carbon molecule (C3 plants) and some as a four-carbon molecule (C4 plants). On the one hand, C3 plants include certain types of trees and shrubs that are found in relatively wet environments and have lower ratios of 13C compared to 12C. C4 plants, on the other hand, include plants from drier environments like savannahs and grasslands. C4 plants have higher ratios of 13C to 12C than C3 plants (Renfrew and Bahn 2016, 312). These ratios remain stable as you go up the food chain. Therefore, you can analyze the bones and teeth of an animal to identify the 13C/12C ratios and identify the types of plants that animal was eating.
The ratios of stable nitrogen isotopes 15N and 14N can also give information about the diet of fossilized or deceased organisms. Though initially absorbed from water and soils by plants, the nitrogen ratios change depending on the primary diet of the organism. An animal who has a mostly vegetarian diet will have lower ratios of 15N to 14N, while those further up the food chain, like carnivores, will have higher ratios of 15N. Interestingly, breastfeeding infants have a higher nitrogen ratio than their mothers, because they are getting all of their nutrients through their mother’s milk. So nitrogen can be used to track life events like weaning (Jay et al. 2008, 2). A marine versus terrestrial diet will also affect the nitrogen signatures. Terrestrial diets have lower ratios of 15N than marine diets. In the course of human evolution, this type of analysis can help us identify important changes in human nutrition. It can help anthropologists figure out when meat became a primary part of the ancient human diet or when marine resources began to be used. The ratios of stable nitrogen isotopes can also be used to determine a change in status, as in the case of the Llullaillaco children (the “ice mummies”) found in the Andes Mountains (Wilson et al. 2007). Although the two younger children had little changes in their diets in the last year of their short lives, the changes in their nitrogen values were significant enough to suggest that the improvement in their diets may have been attributed to the Incas’ desire to sacrifice healthy, high-status children” (Faux 2012, 6).
Migration
Stable isotopes can also tell a great deal about where an individual lived and whether they migrated during their lifetime. The geology of Earth varies because rocks and soils have different amounts or ratios of certain elements in them. These variations in the ratios of isotopes of certain elements are called isotopic signatures. They are like a chemical fingerprint for a geographical region. These isotopes get into the groundwater and are absorbed by plants and animals living in that area. Elements like strontium, oxygen, and nitrogen, among others, are then used by the body to build bones and teeth. If you ate and drank local water all of your life, your bones and teeth would have the same isotopic signature as the geographical region in which you lived.
However, most people (and animals) move around during their lifetimes. Isotopic signatures can be used to identify migration patterns in organisms (Montgomery et al. 2005). Teeth develop in early childhood. If the isotopes of teeth are analyzed, these isotopes would resemble those found in the geographic area where an individual lived as a child. Bones, however, are a different story. Bones are constantly changing throughout life. Old cells are removed and new cells are deposited to respond to growth, healing, activity change, and general deterioration. Therefore, the isotopic signature of bones will reflect the geographical area in which an individual spent the last seven to ten years of life. If an individual has different isotopic signatures for their bones and teeth, it could indicate a migration some time during their life after childhood.

Recent work involving stable isotope analysis has been done on the cremation burials from Stonehenge, in Wessex, England (Figure 7.37). Much of the archaeological work at Stonehenge in the past focused on the building and development of the monument itself. That is partly because most of the burials at the monument were cremated remains, which are difficult to study because of their fragmentary nature and the chemical alterations that bone and teeth undergo when heated. The cremation process complicates the oxygen and carbon isotopes. However, the researchers determined that strontium would not be affected by heating and could still be analyzed in cranial fragments. Using the remains of 25 individuals, they compared their strontium signatures to the geology of Wessex and other regions of the UK. Fifteen of those individuals had strontium signatures that matched the local geology. This means that in the last ten or so years of their lives, they lived and ate food from around Stonehenge. However, ten of the individuals did not match the local geologic signature. These individuals had strontium ratios more closely aligned with the geology of west Wales. Archaeologists find this particularly interesting because in the early phases of Stonehenge’s construction, the smaller “blue stones” were brought 200 km from Wales in a feat of prehistoric engineering. These larger regional connections show that Stonehenge was not just a site of local importance. It dominated a much larger region of influence and drew people from all over ancient Britain (Snoeck et al. 2018).
SPECIAL TOPIC: COLD CASE NAIA
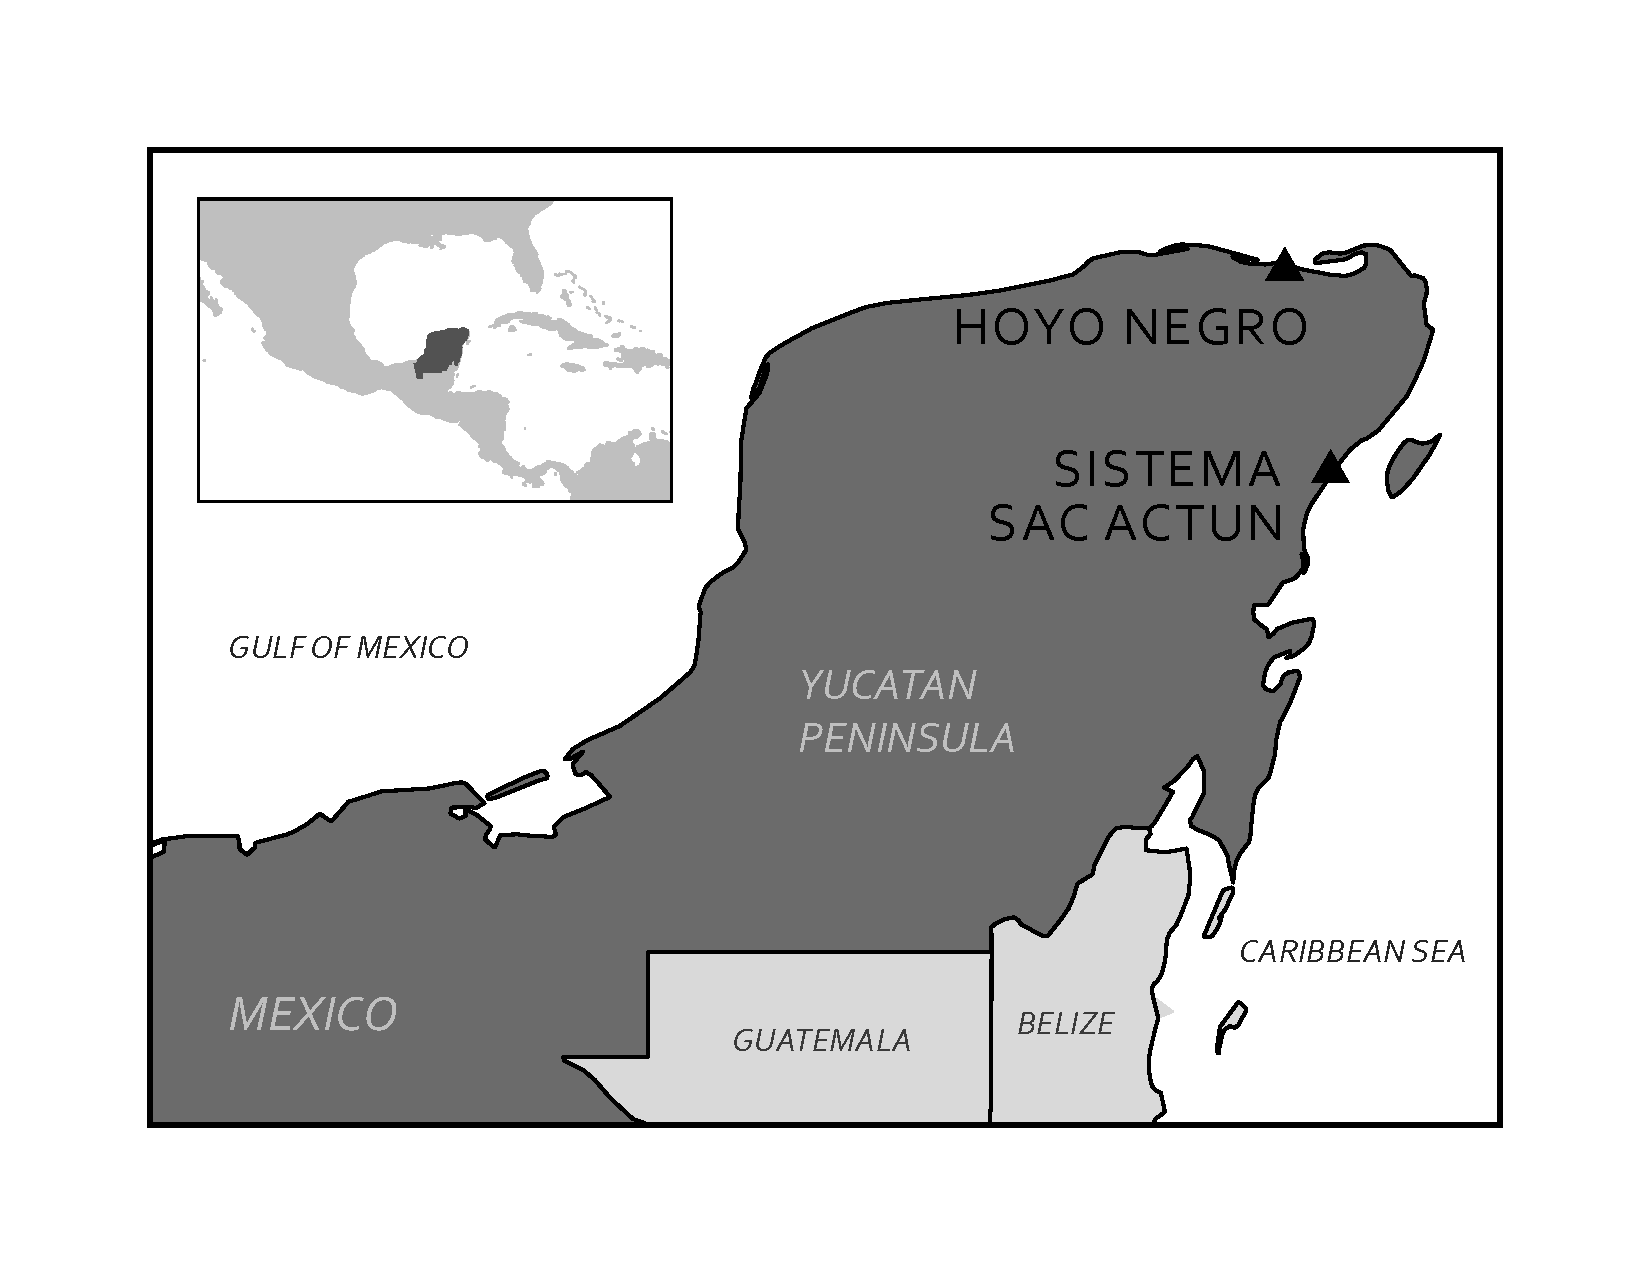
In 2007, cave divers exploring the Sistema Sac Actun in the Yucatán Peninsula in Mexico (see Figure 7.38) discovered the bones of a 15- to 16-year-old female human along with the bones of various extinct animals from the Pleistocene (Figures 7.39 and 7.40) (Collins et al. 2015). The site was named Hoyo Negro (“Black Hole”). The human bones belonged to a Paleoindian, later named “Naia” after a Greek water nymph. Examination of the partially fossilized remains revealed a great deal about Naia’s life, and the radiocarbon dating of her tooth enamel indicated that she lived some 11,000 years ago (Chatters et al. 2014). Naia’s arms were not overly developed, so her daily activities did not involve heavy carrying or grinding of grain or seeds. Her legs, however, were quite muscular, implying that Naia was used to walking long distances. Naia’s teeth and bones indicate habitually poor nutrition. There is evidence of violent injury during the course of Naia’s life from a healed spiral fracture of her left forearm. Naia also suffered from tooth decay and osteoporosis even though she appeared young and undersize. Dr. Jim Chatters hypothesizes that Naia entered the cave at a time when it was not flooded, probably looking for water. She may have become disoriented and fell off a high ledge to her death. The trauma to her pelvis is consistent with such an injury (Watson 2017).

Although Naia’s skeleton is incomplete, it is more complete than any other “New World skeleton” ever found. As divers were able to locate her skull, Naia’s physical appearance in life could be interpreted. Surprisingly, in examining the skull, it was determined that Naia did not resemble modern Native Americans. However, the mitochondrial DNA (mtDNA) recovered from a tooth indicates that Naia shares her DNA with modern Native Americans whose DNA has been linked conclusively to ancestors in Siberia. This means that Naia proves the theory that there was a migration over the land bridge known as Beringia after the last ice age and that the changes in craniofacial morphology are due to evolution after the migration (Chatters et al. 2014).
SUMMARY
With a timeline that extends back some 4.6 billion years, Earth has witnessed continental drift, environmental changes, and a growing complexity of life. Fossils, the mineralized remains of living organisms, provide physical evidence of life and the environment on the planet over the course of billions of years. Early fossil hunter Mary Anning had a profound influence on the way scholars, including Charles Darwin, interpreted evolutionary history. In order to better understand the fossil record, anthropologists rely on the collaboration of numerous academic fields and disciplines. Anthropologists use a variety of scientific methods, both relative and chronometric, to analyze fossils to determine age, origins, and migration patterns as well as to provide insight into the health and diet of the fossilized organism. While each method has its advantages, disadvantages, and limited applications, these tools enable anthropologists to theorize how all living organisms evolved, including the evolution of early humans into modern humans, H. sapiens. The fossil record is far from complete, but our expanding understanding of the fossil context, with exciting new discoveries and improved scientific methods, enables us to document the history of our planet and the evolution of life on Earth.
Review Questions
- In what ways did early paleontologists shape our modern methods of fossil extraction and analysis?
- What kind of information could you acquire from a single fossil? What could it tell you about the broader environment?
- What factors would you take into consideration when deciding which dating method to use for a particular artifact?
- How do stable isotopes help us reconstruct past environments and lifestyles?
Key Terms
Amino acid racemization: A chronometric dating method that measures the ratio of L-form to D-form amino acids in shell, bone, and teeth to establish elapsed time since death.
Anaerobic: An oxygen-free environment.
Anthropocene: The proposed name for our current geologic epoch based on human-driven climate change.
Argon-argon (Ar-Ar) dating: A chronometric dating method that measures the ratio of argon gas in volcanic rock to estimate time elapsed since the volcanic rock cooled and solidified. See also potassium-argon dating.
Atom: A small building block of matter.
Bezoars: Hard, concrete-like substances found in the intestines of fossil creatures.
Biostratigraphy: A relative dating method that uses other plant and animal remains occurring in the stratigraphic context to establish time depth.
Bog bodies: Bodies preserved in the peaty, waterlogged bogs, typically in northern Europe.
Bya: Billion years ago.
Catastrophism: The theoretical perspective that Earth is young and that any changes in the landscape resulted from sudden catastrophic events like volcano eruptions and floods.
Chronometric dating: Dating methods that give estimated numbers of years for artifacts and sites.
Continental drift: The slow movement of continents over time.
Coprolite: Fossilized poop.
Cultural dating: The relative dating method that arranges human-made artifacts in a time frame from oldest to youngest based on material, production technique, style, and other features.
Deep Time: James Hutton’s theory that the world was much older than biblical explanations allowed. This age could be determined by gradual natural processes like soil erosion.
Dendrochronology: A chronometric dating method that uses the annual growth of trees to build a timeline into the past.
Electron spin resonance dating: A chronometric dating method that measures the background radiation accumulated in material over time.
Element: Matter that cannot be broken down into smaller matter.
Epochs: The smallest units of geologic time, spanning thousands to millions of years.
Eon: The largest unit of geologic time, spanning billions of years and divided into subunits called eras, periods, and epochs.
Eras: Units of geologic time that span millions to billions of years and that are subdivided into periods and epochs.
Extant: A word used to describe species that are currently alive today.
Extinct: A word used to describe species that are no longer represented by living organisms.
Fission track dating: A chronometric dating method that is based on the fission of 283U.
Fluorine dating: A relative dating method that analyzes the absorption of fluorine in bones from the surrounding soils.
Foraminifera: Single-celled marine organisms with shells.
Fossils: Mineralized copies of organisms or activity imprints.
Fossilization: The process by which an organism becomes a fossil.
Glacial periods: Periods characterized by low global temperatures and the expansion of ice sheets on Earth’s surface.
Holocene: The geologic epoch from 10 kya to present. (See the discussion on Anthropocene for the debate on the current epoch name.)
Hominin: The term used for humans and their ancestors after the split with chimpanzees and bonobos.
Ice mummy: A specimen of human remains that is naturally mummified by extreme low temperatures.
In matrix: When a fossil is embedded in a substance, such as igneous rock.
Isotopes: Variants of elements.
Kya: Thousand years ago.
Law of Superposition: The scientific law that states that rock and soil are deposited in layers, with the youngest layers on top and the oldest layers on the bottom.
Lithification: The process by which the pressure of sediments squeeze extra water out of decaying remains and replace the voids that appear with minerals from the surrounding soil and groundwater.
Luminescence dating: The chronometric dating method based on the buildup of background radiation in pottery, clay, and soils.
Megafauna: Large animals such as mammoths and mastodons.
Mitochondrial DNA: DNA located in the mitochondria of a cell that is only passed down from biological mother to child.
Mya: Million years ago.
Paleomagnetic/geomagnetic reversal: Periods in Earth’s history when magnetic north and south move significantly from their current positions.
Pangea: A supercontinent that existed during the Paleozoic era.
Periods: Geologic time units that span millions of years and are subdivided into epochs.
Permineralization: When minerals from water impregnate or replace organic remains, leaving a fossilized copy of the organism.
Petrified wood: A fossilized piece of wood in which the original organism is completely replaced by minerals through petrifaction.
Potassium-argon (K-Ar) dating: A chronometric dating method that measures the ratio of argon gas in volcanic rock to estimate time elapsed since the volcanic rock cooled and solidified. See also argon-argon dating.
Pseudofossils: Natural rocks or mineral formations that can be mistaken for fossils.
Radioactive decay: The process of transforming the atom by spontaneously releasing energy.
Radiocarbon dating: The chronometric dating method based on the radioactive decay of 14C in organic remains.
Relative dating: Dating methods that do not result in numbers of years but, rather, in relative timelines wherein some organisms or artifacts are older or younger than others.
Sediment cores: Core samples taken from lake beds or other water sources for analysis of their pollen.
Stable isotopes: Variants of elements that do not change over time without outside interference.
Stratigraphy: A relative dating method that is based on ordered layers or (strata) that build up over time.
Taphonomy: The study of what happens to an organism after death.
Tectonic Plate Theory: The scientific theory that Earth is divided into plates that are capable of movement.
Trace fossils: Fossilized remains of activity such as footprints.
Uniformitarianism: The theoretical perspective that the geologic processes observed today are the same as the processes operating in the past.
Unstable isotopes: Variants of elements that spontaneously change into stable isotopes over time.
About the Authors
Sarah S. King
Cerro Coso Community College

Dr. Sarah S. King is an anthropology/sociology professor at Cerro Coso Community College in California. She completed her Ph.D. work at the Division of Archaeological, Geographical and Environmental Sciences at the University of Bradford in West Yorkshire, England. Her thesis was entitled “What Makes War?: Assessing Iron Age Warfare Through Mortuary Behavior and Osteological Patterns of Violence.” She also holds anthropology degrees from the University of California, Santa Cruz (B.A. hons., 2004), and the University of New Mexico, Albuquerque (M.A., 2006).
Lee Anne Zajicek

Lee Anne Zajicek is a grandmother and a retired homeschool mother of four children who are assimilating into four-year universities via the California Community College system. Mrs. Zajicek received her B.A. in history at Mary Washington College, in Fredericksburg, Virginia, and most recently has worked on her MLitt in archaeological studies at the University of the Highlands and Islands, in Orkney, Scotland, UK. A former Montessori preschool teacher, Ms. Zajicek currently works as a curation assistant at the Maturango Museum in both history and archaeology.
For Further Exploration
Books
Bjornerud, Marcia. 2006. Reading the Rocks: The Autobiography of the Earth. New York: Basic Books.
Brusatte, Steve. 2018. The Rise and Fall of the Dinosaurs: A New History of a Lost World. New York: William Morrow.
Dolnick, Edward. 2011. The Clockwork Universe: Isaac Newton, the Royal Society, and the Birth of the Modern World. New York: Harper Collins.
Emling, Shelley. 2011. The Fossil Hunter: Dinosaurs, Evolution, and the Woman Whose Discoveries Changed the World. New York: St. Martin’s Griffin.
Hazen, Robert M. 2013. The Story of Earth: The First 4.5 Billion Years, From Stardust to Living Planet. New York: Viking Penguin.
Holmes, Richard. 2010. The Age of Wonder: The Romantic Generation and the Discovery of the Beauty and Terror of Science. New York: Vintage.
Horner, Jack, and James Gormer. 2009. How to Build a Dinosaur. Boston: Dutton Books.
Murck, Barbara. 2001. Geology: A Self-Teaching Guide. New York: John Wiley & Sons.
Palmer, Douglas. 2005. Earth Time: Exploring the Deep Past From Victorian England to the Grand Canyon. New York: John Wiley & Sons.
Prothero, Donald R. 2015. The Story of Life in 25 Fossils: Tales of Intrepid Fossil Hunters and the Wonder of Evolution. New York: Columbia University Press.
Pyne, Lydia. 2016. Seven Skeletons: The Evolution of the World’s Most Famous Human Fossils. New York: Viking Books.
Reinhard, Johan. 2006. Ice Maiden: Inca Mummies, Mountain Gods, and Sacred Sites in the Andes. Washington, D.C.: National Geographic.
Repcheck, Jack. 2009. The Man Who Found Time: James Hutton and the Discovery of the Earth’s Antiquity. New York: Basic Books.
Taylor, Paul D. 2014. A History of Life in 100 Fossils. Washington, D.C.: Smithsonian Books.
Ward, David. 2002. Smithsonian Handbooks: Fossils. Washington, D.C.: Smithsonian Books.
Winchester, Simon. 2009. The Map That Changed the World: William Smith and the Birth of Modern Geology. New York: Harper Perennial.
Videos
Andrew, Danielle. 2015. “What Did Neanderthals Sound Like?” Retrieved from IFL Science, April 1. http://www.iflscience.com/plants-and-animals/could-neanderthals-have-high-pitched-voices/
Coleman, David, dir. 2012. “Lucy.” Prehistoric Autopsy, part 3. 52 min. Glasgow, UK: BBC Productions. Video.
College Humor staff. 2015. “If Jurassic Park Were in Different Geologic Eras.” College Humor, June 26. http://www.collegehumor.com/video/7025308/if-jurassic-park-were-in-different-geological-eras
Smithsonian.com staff. 2018. “Is the Inca Maiden the World’s Best-Preserved Mummy?” Smithsonian.com, N.d. https://www.smithsonianmag.com/videos/category/history/is-this-the-worlds-best-preserved-mummy/
Townsley, Graham, dir. 2018. First Face of America. 53 min. PBS NOVA. http://www.pbs.org/wgbh/nova/evolution/first-face-america.html
Websites
Amber Museum: http://www.ambermuseum.eu/en/
East Tennessee State University Center of Excellence in Paleontology: https://www.etsu.edu/cas/paleontology/
Granger Historical Picture Archive: Granger.com
La Brea Tar Pits Museum: https://tarpits.org
Lyme Regis Philpot Museum: http://www.lymeregismuseum.co.uk
Natural History Museum of London, Mary Anning: http://www.nhm.ac.uk/discover/mary-anning-unsung-hero.html
Pech Merle Cave: http://en.pechmerle.com
Petrified Forest National Park (NE Arizona): https://www.nps.gov/pefo/index.htm
Poozeum: The No. 2 Wonder of the World: http://www.poozeum.com/poop-s-past.html
The Scoop on Poop!: https://www.floridamuseum.ufl.edu/exhibits/scoop/
Smithsonian National Museum of Natural History Department of Paleobiology: https://paleobiology.si.edu/fossiLab/projects.html
Smithsonian National Museum of Natural History Human Origins: http://humanorigins.si.edu
References
Adhikari, Surendra, and Erik R. Ivins. 2016. “Climate-Driven Polar Motion: 2003–2015.” Science Advances 2(4): e1501693.
Antoine, Pierre-Oliver, Maeva J. Orliac, Gokhan Atici, Inan Ulusoy, Erdal Sen, H. Evren Çubukçu, Ebru lbayrak, Neşe Oyal, Erkan Aydar, and Sevket Sen. 2012. “A Rhinocerotid Skull Cooked to Death in a 9.2 Mya-Old Ignimbrite Flow of Turkey.” PLoS ONE 7 (11): e49997.
Aufderheide, Arthur C. 2003. The Scientific Study of Mummies. Cambridge, UK: Cambridge University Press.
Barr, James. 1984. “Why the World Was Created in 4004 BC: Archbishop Ussher and Biblical Chronology,” Bulletin of the John Rylands University Library of Manchester 67: 575–608.
Booth, Thomas J., Andrew T. Chamberlain, and Mike Parker Pearson. 2015. “Mummification in Bronze Age Britain.” Antiquity 89 (347): 1,155–1,173.
Braterman, Paul S. 2013. “How Science Figured Out the Age of the Earth.” Special issue, “Determining the Age of the Earth,” Scientific American, October 20. https://www.scientificamerican.com/article/how-science-figured-out-the-age-of-the-earth/
Brown, Theodore L., H. Eugene LeMay Jr., Bruce E. Burston, Catherine J. Murphy, Patrick M. Woodward, and Matthew Stoltzfus. 2018. Chemistry: The Central Science. New York: Pearson.
Campbell, Neil A. and Jane B. Reece. 2005. Biology 7th ed. New York, NY: Pearson
Carvajal, Eduar, Luis Montes, and Ovidio A. Almanza. 2011. “Quaternary Dating by Electron Spin Resonance (ESR) Applied to Human Tooth Enamel.” Earth Sciences Research Journal 15 (2): 115–120.
Chatters, James C., Douglas J. Kennett, Yemane Asmerom, Brian M. Kemp, Victor Polyak, Alberto Nava Blank, Patricia A. Beddows, et al. 2014. “Late Pleistocene Human Skeleton and mtDNA Link Paleoamericans and Modern Native Americans.” Science 344 (6,185): 750–754.
Cochrane, Grant W. G., Trudy Doelman, and Lyn Wadley. 2013. “Another Dating Revolution for Prehistoric Archaeology?” Journal of Archaeological Method and Theory 20 (1): 42–60.
Collins, S. V., E. G. Reinhardt, D. Rissolo, J. C. Chatters, A. Nava-Blank, and P. Luna-Erreguerena. 2015. “Reconstructing Water Level in Hoyo Negro, Quintana Roo, Mexico, Implications for Early Paleoamerican and Faunal Access.” Quaternary Science Reviews 124: 68–83.
Cook, Harold J. 1928. “Glacial Age Man in New Mexico.” Scientific American 139 (1): 38–40.
Cook, S. F., and H. C. Ezra-Cohn. 1959. “An Evaluation of the Fluorine Dating Method.” Southwestern Journal of Anthropology 15 (3): 276–290.
Crompton, Robin H., Todd C. Pataky, Russell Savage, Kristiaan D’Août, Matthew R. Bennett, Michael H. Day, Karl Bates, Sarita Morse, and William I. Sellers. 2011. “Human-like External Function of the Foot, and Fully Upright Gait, Confirmed in the 3.66 Million Year Old Laetoli Hominin Footprints by Topographic Statistics, Experimental Footprint-Formation and Computer Simulation,” Journal of the Royal Society Interface 9 (69): 707–719.
Crutzen, Paul J., and Eugene F. Stoermer. 2000. “The ‘Anthropocene.’” Global Change Newsletter 41: 17–18.
Darwin, Charles. 1859. On the Origin of Species. London, UK: John Murray.
Dean, Jeffery S. 2009. “One Hundred Years of Dendroarchaeology: Dating, Human Behavior, and Past Climate.” In Tree-rings, Kings, and Old World Archaeology and Environment: Papers Presented in Honor of Peter Ian Kuniholm. Edited by S. Manning and M. J. Bruce. Oxford, UK: Oxbow Books.
De Groote, Isabelle, Linus Girdland Flink, Rizwaan Abbas, Silvia M. Bello, Lucia Burgia, Laura Tabitha Buck, Christopher Dean, et al. 2016. “New Genetic and Morphological Evidence Suggests a Single Hoaxer Created ‘Piltdown Man.’” Royal Society Open Science 3: 160328.
Dent, John S. 1982. “Cemeteries and Settlement Patterns of the Iron Age on the Yorkshire Wolds.” Proceedings of the Prehistoric Society 48: 437–457.
Dolnick, Edward. 2011. The Clockwork Universe: Isaac Newton, the Royal Society, and the Birth of the Modern World. New York: HarperCollins.
Drake, Nadia. 2018. “No, We’re Not All Doomed by Earth’s Magnetic Field Flip.” National Geographic, February 7. https://news.nationalgeographic.com/2018/01/earth-magnetic-field-flip-north-south-poles-science/
Duller, G.A.T. 2008. Luminescence Dating: Guidelines on Using Luminescence Dating in Archaeology. Swindon, UK: English Heritage.
Eisenbeiss, Sabine. 2016. “Preserved in Peat: Decoding Bodies from Lower Saxony, Germany.” Expedition 58 (2): 18–21.
Emling, Shelley. 2009. The Fossil Hunter: Dinosaurs, Evolution, and the Woman Whose Discoveries Changed the World. New York: St. Martin’s Griffin.
Faux, Jennifer L. 2012. “Hail the Conquering Gods: Ritual Sacrifice of Children in Inca Society.” Journal of Contemporary Anthropology 3 (1): 1–15.
Feder, Kenneth L. 2017. The Past in Perspective: An Introduction to Human Prehistory. 7th Ed. New York: Oxford University Press.
Flowers, Paul, Klaus Theopold, Richard Langley, and William R. Robinson. 2018. Chemistry. Houston, TX: Openstax, Rice University.
Granger, Darryl E., Ryan J. Gibbon, Kathleen Kuman, Ronald J. Clarke, Laurent Bruxelles, and Marc W. Caffee. 2015. “New Cosmogenic Burial Ages for Sterkfontein Member 2 Australopithecus and Member 5 Oldowan.” Nature 522 (7,554): 85–88.
Granger Historical Picture Archive. 2018. Cro-Magnon Footprint. Image no. 0167868. https://www.granger.com/results.asp?image=0167868&itemw=4&itemf=0001&itemstep=1&itemx=11&screenwidth=1085
Gubbins, David. 2008. “Earth Science: Geomagnetic Reversals.” Nature 452 (7184): 165–167.
Haddy, A., and A. Hanson. 1982. “Research Notes and Application Reports Nitrogen and Fluorine Dating of Moundville Skeletal Samples. Archaeometry 24 (1): 37–44.
Hatala, Kevin G., Brigitte Demes, Brian G. Richmond. 2016. “Laetoli Footprints Reveal Bipedal Gait Biomechanics Different From Those of Modern Humans and Chimpanzees,” Proceedings of the Royal Society B 283: 20160235. http://dx.doi.org/10.1098/rspb.2016.0235
Hester, Thomas R., Harry J. Shafer, and Kenneth L. Feder. 1997. Field Methods in Archaeology (7th Ed.). Mountain View, CA: Mayfield Publishing.
Hillam, J., C. M. Groves, D. M. Brown, M. G. L. Baillie, J. M. Coles, and B. J. Coles. 1990. “Dendrochronology of the English Neolithic.” Antiquity 64 (243): 210–220.
Holmes, Richard. 2010. The Age of Wonder: How the Romantic Generation Discovered the Beauty and Terror of Science. New York: Vintage.
Ingber, Sasha. 2012. “Volcano Eruption Baked Rare Rhino Fossil,” National Geographic. November 30. Accessed July 25, 2018.
Jay, Mandy, B. T. Fuller, Michael P. Richards, Christopher J. Knüsel, and Sarah S. King. 2008. “Iron Age Breastfeeding Practices in Britain: Isotopic Evidence From Wetwang Slack, East Yorkshire.” American Journal of Physical Anthropology 136 (3): 327–337.
King, Sarah S. 2010. “What Makes War? Assessing Iron Age Warfare through Mortuary Behaviour and Osteological Patterns of Violence.” Ph.D. thesis, Department of Archaeological Sciences, University of Bradford.
———. 2014. “Socialized Violence: Contextualizing Violence through Mortuary Behaviour in Iron Age Britain.” In The Routledge Handbook of the Bioarchaeology of Human Conflict. Edited by Christopher Knüsel and Martin J. Smith. New York: Routledge.
Klein, Richard G. 1999. The Human Career: Human Biological and Cultural Origins. Second ed. Chicago: University of Chicago Press.
Komar, Debra A., and Jane E. Buikstra. 2008. Forensic Anthropology: Contemporary Theory and Practice. New York: Oxford University Press.
Komutrattananont, P. , and P. Mahakkanukrauh. 2017. “Age Estimation by Using Aspartic Acid Racemization From Purified Elastin of Aorta.” Medicine and Health 12 (2): 170–178.
Kuniholm, Peter Ian, and Cecil L. Striker. 1987. “Dendrochronological Investigations in the Aegean and Neighboring Regions, 1983–1986.” Journal of Field Archaeology 14 (4): 385–398.
Laurenzi, Marinella A., Maria Laura Balestrieri, Giulio Bigazzi, Julio C. Hadler Neto, Pedro J. Iunes, Pio Norelli, Massimo Oddone, Ana Maria Osorio Araya, and José G. Viramonte. 2007. “New Constraints on Ages of Glasses Proposed as Reference Materials for Fission-Track Dating.” Geostandards & Geoanalytical Research 31 (2): 105–124.
Lebatard, Anne-Elisabeth, Didier L. Bourlès, Philippe Duringer, Marc Jolivet, Régis Braucher, Julien Carcaillet, Mathieu Schuster, et al. 2008. “Cosmogenic nuclide dating of Sahelanthropus tchadensis and Australopithecus bahrelghazali: Mio-Pliocene hominids from Chad.” Proceedings of the National Academy of Sciences 105 (9): 3,226–3,231.
Leinhard, John H. 1998. “The Age of the Earth: Science, Religion, and Perception.” Distinguished Lecture presented for the Shell Distinguished Lecture Series, Shell E&P Technology Company, Houston, May 21. https://www.uh.edu/engines/shell.htm
Lyell, Charles. 1830-1833. Principles of geology, being an attempt to explain the former changes of the Earth’s surface, by reference to causes now in operation. Volumes 1, 2 and 3. London: John Murray
Maixner, Frank, Dmitrij Turaev, Amaury Cazenave-Gassiot, Marek Janko, Ben Krause-Kyora, Michael R. Hoopmann, Ulrike Kusebauch, et al. 2018. “The Iceman’s Last Meal Consisted of Fat, Wild Meat, and Cereals.” Current Biology Report 28 (14): 2,348–2,355.
Masao, Fidelis T., Elgidius B. Ichumbaki, Marco Cherin, Angelo Barili, Giovanni Boschian, David A. Lurino, Sofia Menconero, Jacopo Moggi-Cecchi, and Giorgio Manzi. 2016. “New Footprints From Laetoli (Tanzania) Provide Evidence for Marked Body Size Variation in Early Hominins.” eLife 5: e19568. https://elifesciences.org/articles/19568
Michels, Joseph W. 1972. “Dating Methods.” Annual Review of Anthropology 1: 113–126.
Monastersky, Richard. 2015. “Anthropocene: The Human Age.” Nature 519 (7,542): 144–147.
Montgomery, Janet, Jane A. Evans, Dominic Powlesland, and Charlotte A. Roberts. 2005. “Continuity or Colonization in Anglo-Saxon England? Isotope Evidence for Mobility, Subsistence Practice, and Status at West Heslerton.” American Journal of Physical Anthropology 126 (2): 123–138.
Murck, Barbara. 2001. Geology: A Self-Teaching Guide. New York: John Wiley & Sons.
Pastoors, Andreas, Tilman Lenssen-Erz, Bernd Breuckmann, Tsamkxao Ciqae, Ui Kxunta, Dirk Rieke-Zapp, and Thui Thao. 2017. “Experience Based Reading of Pleistocene Human Footprints in Pech-Merle.” Quaternary International 430 (A): 155–162.
Pickrell, John. 2017. Ticks That Fed on Dinosaurs Found Trapped in Amber. National Geographic, December 12. https://news.nationalgeographic.com/2017/12/tick-dinosaur-feather-found-in-amber-blood-parastites-science/
Potts, Richard. 2012. “Evolution and Environmental Change in Early Human Prehistory.” Annual Review of Anthropology 41: 151–167.
Raichlen David A. and Adam D. Gordon. 2017. “Interpretation of Footprints From Site S Confirms Human-like Bipedal Biomechanics in Laetoli Hominins,” Journal of Human Evolution 107: 134–138.
Ravn, Morten. 2010. “Bronze and Early Iron Age Bog Bodies From Denmark.” Acta Archaeologica 81 (1): 112–113.
Reimer, Paula J., Edouard Bard, Alex Bayliss, J. Warren Beck, Paul G. Blackwell, Christopher Bronk Ramsey, Caitlin E. Buck, et al. 2013. “INTCAL13 and Marine13 Radiocarbon Age Calibration Curves 0–50,000 Years cal BP.” Radiocarbon 55 (4): 1,869–1,887.
Reinhard, Johan. 2016. “Frozen Mummies of the Andes.” Expedition 58 (2): n. pag. https://www.penn.museum/sites/expedition/frozen-mummies-of-the-andes/
Reitz, Elizabeth J., and Elizabeth S. Wing. 1999. Zooarchaeology. Cambridge, UK: Cambridge University Press.
Renfrew, Colin, and Paul Bahn. 2016. Archaeology: Theories, Methods, and Practice. Seventh ed. New York: Thames and Hudson.
Repcheck, Jack. 2009. The Man Who Found Time: James Hutton and the Discovery of the Earth’s Antiquity. New York: Basic Books.
Rowling, J. K. 1998. Harry Potter and the Sorcerer’s Stone. New York: Scholastic.
Rowling, J. K. 2005. Harry Potter and the Half-Blood Prince. New York: Scholastic.
Ruddiman, William F., Zhengtang Guo, Xin Zhou, Hanbin Wu, and Yanyan Yu. 2008. “Early Rice Farming and Anomalous Methane Trends.” Quaternary Science Reviews 27 (13–14): 1,291–1,295.
Russell, Randy. 2007. Earth’s Magnetic Poles. Windows to the Universe, August 22. https://www.windows2universe.org/earth/Magnetosphere/earth_magnetic_poles.html
Smithsonian National Museum of Natural History. 2018. Laetoli Footprint Trails. Smithsonian National Museum of History, October 23. http://humanorigins.si.edu/evidence/behavior/footprints/laetoli-footprint-trails
Snoeck, Christophe, John Pouncett, Philippe Claeys, Steven Goderis, Nadine Mattielli, Mike Parker Pearson, Christie Willis, Antoine Zazzo, Julia A. Lee-Thorp, and Rick J. Schulting. 2018. “Strontium Isotope Analysis on Cremated Human Remains From Stonehenge Support[sic] Links With West Wales.” Scientific Reports 8. https://www.nature.com/articles/s41598-018-28969-8
Steffen, Will, Johan Rockström, Katherine Richardson, Timothy M. Lenton, Carl Folke, Diana Liverman, Colin P. Summerhayes, et al. 2018. “Trajectories of the Earth System in the Anthropocene.” PNAS 115 (33): 8,252–8,259.
Stodder, Ann L. W. 2008. “Taphonomy and the Nature of Archaeological Assemblages.” In Biological Anthropology of the Human Skeleton. Edited by M. Anne Katzenberg and Shelley R. Saunders, 71–115. Hoboken, NJ: Wiley Blackwell.
Straus, Lawrence Guy. 1989. “Grave Reservations: More on Paleolithic Burial Evidence.” Current Anthropology 30 (5): 633–634.
Sullivan, Terry and Harry Gifford. 1908. She sells sea-shells. London: Francis, Day, and Hunter.
United States Geological Survey. Historical Perspectives. 2012. United States Geological Survey, last updated August 7. https://pubs.usgs.gov/gip/dynamic/historical.html
University of the Witwatersrand. 2017. “Little Foot Takes a Bow: South Africa’s Oldest and the World’s Most Complete Australopithecus Skeleton Ever Found, Introduced to the World.” ScienceDaily, December 6. https://www.sciencedaily.com/releases/2017/12/171206100104.htm
Valet, Jean-Pierre, Hélène Valladas. 2010. “The Laschamp-Mono Lake Geomagnetic Events and the Extinction of Neanderthal: A Causal Link or a Coincidence?” Quaternary Science Reviews 29(27–28): 3,887–3,893. https://doi.org/10.1016/j.quascirev.2010.09.010
Vidale, M., L. Bondioli, D. W. Frayer, M. Gallinaro, and A. Vanzetti. 2016. “Ötzi the Iceman.” Expedition 58 (2): 13–17. https://www.penn.museum/sites/expedition/otzi-the-iceman/
Wallace, Steven C., and Xiaoming Wang. 2004. “Two New Carnivores From an Unusual Late Tertiary Forest Biota in Eastern North America.” Nature 431 (7,008): 556–559.
Waters, Colin N., Jan Zalasiewicz, Anthony D. Barnosky, Alejandro Cearreta, Agieszka Galuszka, Juliana A. Ivar Do Sul, Catherine Jeandel, et al. N.d. “Is the Anthropocene Distinct From the Holocene?” In Strati 2015 2nd International Congress on Stratigraphy, Graz, Austria, July 19–23, 2015. Unpublished MS.
Watson, Traci. 2017. “Ancient Bones Reveal Girl’s Tough Life in Early Americas.” Nature 544 (7,648): 15–16.
White, Tim D. 1986. “Cut Marks on the Bodo Cranium: A Case of Prehistoric Defleshing.” American Journal of Physical Anthropology 69 (4): 503–509.
Williams, Linda D. 2004. Earth Science Demystified. New York: McGraw-Hill Professional.
Wilson, Andrew S., Timothy Taylor, Maria Constanza Ceruti, Jose Antonio Chavez, Johan Reinhard, Vaughan Grimes, Wolfram Meier-Augenstein, et al. 2007. “Stable Isotope and DNA Evidence for Ritual Sequences in Inca Child Sacrifice.” PNAS 104 (42): 16,456–16,461.
Wolchover, Natalie. 2012. “What If Earth’s Magnetic Poles Switch?” Live Science, February 10. https://www.livescience.com/18426-earth-magnetic-poles-flip.html
Acknowledgements
The authors thank the staff of the Maturango Museum, Ridgecrest, California—and, specifically, Debbie Benson, executive director; Alexander K. Rogers, archaeology curator; Sherry Brubaker, natural history curator; and Elaine Wiley, history curator—for their generous help with photography and fossil images. The authors thank Sharlene Paxton, a librarian at Cerro Coso Community College, Ridgecrest, California, for her guidance and expertise with OER and open-source images, and John Stenger-Smith and Claudia Sellers from Cerro Coso Community College, Ridgecrest, California, for their feedback on the chemistry and plant biology content. Finally, the authors thank William and Lauren Zajicek, our community college students, for providing their impressions and extensive feedback on early drafts of the chapter.
Figure Attributions
Figure 7.1 Mary Anning by B. J. Donne from the Geological Society/NHMPL is in the public domain.
Figure 7.2 A Walk at Dusk (object 93.PA.14 at the J. Paul Getty Museum) by Casper David Friedrich (German 1774-1840) is in the public domain and part of the Getty Open Content Program.
Figure 7.3 lyme-regis-coast-sea-cliffs-924431 by jstarj and has been designated under a Pixabay License.
Figure 7.4 Mary Anning Plesiosaurus by Mary Anning (1799-1847) is in the public domain.
Figure 7.5 Ammonite by Sarah S. King and Lee Anne Zajicek is under a CC BY-NC 4.0 License.
Figure 7.6 Murexsul from the Maturango Museum, Ridgecrest, California, by Sarah S. King and Lee Anne Zajicek is under a CC BY-NC 4.0 License.
Figure 7.7 Geologic time scale by United States Geological Survey is in the public domain.
Figure 7.8 Chooz Nuclear Power Plant-9361 by Raimond Spekking is used under a CC BY-SA 4.0 License.
Figure 7.9 Pangaea continents by LucasVB is used under a CC BY-SA 3.0 License.
Figure 7.10 White Cliffs Of Dover 2 by Eleanor Nelson available on www.PublicDomainPictures.net has been designated to the public domain (CC0 1.0).
Figure 7.11 Etretat 07 August 2005 019 by anonymous is used under a CC BY-SA 3.0 License.
Figure 7.12 Aerial-SanAndreas-CarrizoPlain by John Wiley User:Jw4nvc – Santa Barbara, California is used under a CC BY 3.0 License.
Figure 7.13 Red Panda (25193861686) by Mathias Appel has been designated to the public domain (CC0 1.0).
Figure 7.14 Coyote remains by Sarah S. King is under a CC BY-NC 4.0 License.
Figure 7.15 Fossilization process original to Explorations: An Open Invitation to Biological Anthropology by Mary Nelson is under a CC BY-NC 4.0 License.
Figure 7.16 PetrifiedWood at the Petrified Forest National Park by Jon Sullivan has been designated to the public domain (CC0).
Figure 7.17 Lucy blackbg by 120 is used under a CC BY 2.5 License.
Figure 7.18 Amber2 by Anders L. Damgaard (www.amber-inclusions.dk – Baltic-amber-beetle) is used under a CC BY-SA 3.0 License.
Figure 7.19 Amber.pendants.800pix.050203 by Adrian Pingstone (2003) has been designated to the public domain (CC0).
Figure 7.20 Mammoth Tragedy at La Brea Tar Pits (5463657162) by KimonBerlin is used under a CC BY-SA 2.0 License.
Figure 7.21 Canis dirus (dire wolf) (La Brea Asphalt, Upper Pleistocene, La Brea Tar Pits, California, USA) 3 by James St. John is used under a CC BY 2.0 License.
Figure 7.22 Smilodon saber-toothed tiger skull (La Brea Asphalt, Upper Pleistocene; Rancho La Brea tar pits, southern California, USA) 1 by James St. John is used under a CC BY 2.0 License.
Figure 7.23 NHM – Laetoli Fußspuren by Wolfgang Sauber is used under a CC BY-SA 4.0 License.
Figure 7.24 Precious the Coprolite Courtesy of the Poozeum by Poozeum is used under a CC BY-SA 4.0 License.
Figure 7.25 Dendrites from the Maturango Museum, Ridgecrest, California, by Sarah S. King and Lee Anne Zajicek is under a CC BY-NC 4.0 License.
Figure 7.26 Laetoli and Olduvai Gorge sites original to Explorations: An Open Invitation to Biological Anthropology by Elyssa Ebding at GeoPlace, California State University, Chico is under a CC BY-NC 4.0 License.
Figure 7.27 Woman with bronze cast of Au. afarensis at the Natural History Museum in Washington, D.C., by Lee Anne Zajicek is under a CC BY-NC 4.0 License.
Figure 7.28 Stratigraphic cross-section original to Explorations: An Open Invitation to Biological Anthropology by Mary Nelson is under a CC BY-NC 4.0 License.
Figure 7.29 Bronze Age implements, ornaments and pottery (Period II) by Wellcome Collection is used under a CC BY 4.0 License.
Figure 7.30 Sterkfontein Piltdown man by Anrie is used under a CC BY-SA 3.0 License.
Figure 7.31 Atom Diagram by AG Caesar is used under a CC BY-SA 4.0 License.
Figure 7.32 Radiocarbon dating original to Explorations: An Open Invitation to Biological Anthropology by Mary Nelson is under a CC BY-NC 4.0 License.
Figure 7.33 Çjkgfmj by Abdulkadirtiryaki is used under a CC BY-SA 3.0 License.
Figure 7.34 Dendrochronology original to Explorations: An Open Invitation to Biological Anthropology by Mary Nelson is under a CC BY-NC 4.0 License.
Figure 7.35 Blue Globe by Ken Teegardin is used under a CC BY 2.0 License.
Figure 7.36 Oxygen in deep sea sediment carbonate by NASA Goddard Institute for Space Studies, originally from “Science Briefs: Cold Climates, Warm Climates: How Can We Tell Past Temperatures?”, is in the public domain.
Figure 7.37 Stonehenge by Sarah S. King is under a CC BY-NC 4.0 License.
Figure 7.38 Hoyo Negro and Sistema Sac Actun, Mexico original to Explorations: An Open Invitation to Biological Anthropology by Elyssa Ebding at GeoPlace, California State University, Chico is under a CC BY-NC 4.0 License.
Figure 7.39 Hoyo Negro cenote original to Explorations: An Open Invitation to Biological Anthropology by Mary Nelson is under a CC BY-NC 4.0 License.
A word used to describe species that are no longer represented by living organisms.
A word used to describe species that are currently alive today.
James Hutton’s theory that the world was much older than biblical explanations allowed. This age could be determined by gradual natural processes like soil erosion.
The theoretical perspective that the geologic processes observed today are the same as the processes operating in the past.
The theoretical perspective that Earth is young and that any changes in the landscape resulted from sudden catastrophic events like volcano eruptions and floods.
Mineralized copies of organisms or activity imprints.
Billion years ago.
The largest unit of geologic time, spanning billions of years and divided into subunits called eras, periods, and epochs.
Units of geologic time that span millions to billions of years and that are subdivided into periods and epochs.
Geologic time units that span millions of years and are subdivided into epochs.
The smallest units of geologic time, spanning thousands to millions of years.
The geologic epoch from 10 kya to present. (See the discussion on Anthropocene for the debate on the current epoch name.)
Thousand years ago.
The proposed name for our current geologic epoch based on human-driven climate change.
A supercontinent that existed during the Paleozoic era.
Million years ago.
The slow movement of continents over time.
The scientific theory that Earth is divided into plates that are capable of movement.
The study of what happens to an organism after death.
Bodies preserved in the peaty, waterlogged bogs, typically in northern Europe.
An oxygen-free environment.
A specimen of human remains that is naturally mummified by extreme low temperatures.
The process by which an organism becomes a fossil.
The process by which the pressure of sediments squeeze extra water out of decaying remains and replace the voids that appear with minerals from the surrounding soil and groundwater.
When minerals from water impregnate or replace organic remains, leaving a fossilized copy of the organism.
A fossilized piece of wood in which the original organism is completely replaced by minerals through petrifaction.
The term used for humans and their ancestors after the split with chimpanzees and bonobos.
Large animals such as mammoths and mastodons.
Fossilized remains of activity such as footprints.
Hard, concrete-like substances found in the intestines of fossil creatures.
Fossilized poop.
When a fossil is embedded in a substance, such as igneous rock.
Natural rocks or mineral formations that can be mistaken for fossils.
Dating methods that do not result in numbers of years but, rather, in relative timelines wherein some organisms or artifacts are older or younger than others.
A relative dating method that is based on ordered layers or (strata) that build up over time.
The scientific law that states that rock and soil are deposited in layers, with the youngest layers on top and the oldest layers on the bottom.
A relative dating method that uses other plant and animal remains occurring in the stratigraphic context to establish time depth.
The relative dating method that arranges human-made artifacts in a time frame from oldest to youngest based on material, production technique, style, and other features.
A relative dating method that analyzes the absorption of fluorine in bones from the surrounding soils.
The theoretical perspective that Earth is young and that any changes in the landscape resulted from sudden catastrophic events like volcano eruptions and floods.
Matter that cannot be broken down into smaller matter.
A small building block of matter.
Variants of elements.
Variants of elements that do not change over time without outside interference.
Variants of elements that spontaneously change into stable isotopes over time.
The process of transforming the atom by spontaneously releasing energy.
The chronometric dating method based on the radioactive decay of 14C in organic remains.
A chronometric dating method that measures the ratio of argon gas in volcanic rock to estimate time elapsed since the volcanic rock cooled and solidified. See also argon-argon dating.
A chronometric dating method that measures the ratio of argon gas in volcanic rock to estimate time elapsed since the volcanic rock cooled and solidified. See also potassium-argon dating.
A chronometric dating method that is based on the fission of 283U.
The chronometric dating method based on the buildup of background radiation in pottery, clay, and soils.
A chronometric dating method that measures the background radiation accumulated in material over time.
A chronometric dating method that uses the annual growth of trees to build a timeline into the past.
A chronometric dating method that measures the ratio of L-form to D-form amino acids in shell, bone, and teeth to establish elapsed time since death.
Periods in Earth’s history when magnetic north and south move significantly from their current positions.
Core samples taken from lake beds or other water sources for analysis of their pollen.
Periods characterized by low global temperatures and the expansion of ice sheets on Earth’s surface.
Single-celled marine organisms with shells.
DNA located in the mitochondria of a cell that is only passed down from biological mother to child.

.jpg)