
F Distribution and One-Way ANOVA
One-Way ANOVA
OpenStaxCollege
[latexpage]
The purpose of a one-way ANOVA test is to determine the existence of a statistically significant difference among several group means. The test actually uses variances to help determine if the means are equal or not. In order to perform a one-way ANOVA test, there are five basic assumptions to be fulfilled:
- Each population from which a sample is taken is assumed to be normal.
- All samples are randomly selected and independent.
- The populations are assumed to have equal standard deviations (or variances).
- The factor is a categorical variable.
- The response is a numerical variable.
The Null and Alternative Hypotheses
The null hypothesis is simply that all the group population means are the same. The alternative hypothesis is that at least one pair of means is different. For example, if there are k groups:
H0: μ1 = μ2 = μ3 = … = μk
Ha: At least two of the group means μ1, μ2, μ3, …, μk are not equal.
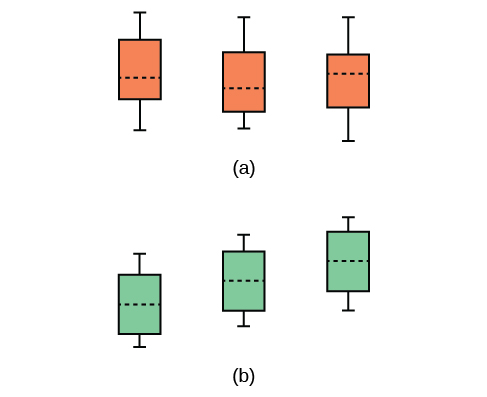
The graphs, a set of box plots representing the distribution of values with the group means indicated by a horizontal line through the box, help in the understanding of the hypothesis test. In the first graph (red box plots), H0: μ1 = μ2 = μ3 and the three populations have the same distribution if the null hypothesis is true. The variance of the combined data is approximately the same as the variance of each of the populations.
If the null hypothesis is false, then the variance of the combined data is larger which is caused by the different means as shown in the second graph (green box plots).
Chapter Review
Analysis of variance extends the comparison of two groups to several, each a level of a categorical variable (factor). Samples from each group are independent, and must be randomly selected from normal populations with equal variances. We test the null hypothesis of equal means of the response in every group versus the alternative hypothesis of one or more group means being different from the others. A one-way ANOVA hypothesis test determines if several population means are equal. The distribution for the test is the F distribution with two different degrees of freedom.
- Each population from which a sample is taken is assumed to be normal.
- All samples are randomly selected and independent.
- The populations are assumed to have equal standard deviations (or variances).
Use the following information to answer the next five exercises. There are five basic assumptions that must be fulfilled in order to perform a one-way ANOVA test. What are they?
Write one assumption.
Each population from which a sample is taken is assumed to be normal.
Write another assumption.
Write a third assumption.
The populations are assumed to have equal standard deviations (or variances).
Write a fourth assumption.
Write the final assumption.
The response is a numerical value.
State the null hypothesis for a one-way ANOVA test if there are four groups.
State the alternative hypothesis for a one-way ANOVA test if there are three groups.
Ha: At least two of the group means μ1, μ2, μ3 are not equal.
When do you use an ANOVA test?
Homework
Three different traffic routes are tested for mean driving time. The entries in the table are the driving times in minutes on the three different routes. The one-way ANOVA results are shown in [link].
| Route 1 | Route 2 | Route 3 |
|---|---|---|
| 30 | 27 | 16 |
| 32 | 29 | 41 |
| 27 | 28 | 22 |
| 35 | 36 | 31 |
State SSbetween, SSwithin, and the F statistic.
SSbetween = 26
SSwithin = 441
F = 0.2653
Suppose a group is interested in determining whether teenagers obtain their drivers licenses at approximately the same average age across the country. Suppose that the following data are randomly collected from five teenagers in each region of the country. The numbers represent the age at which teenagers obtained their drivers licenses.
| Northeast | South | West | Central | East | |
|---|---|---|---|---|---|
| 16.3 | 16.9 | 16.4 | 16.2 | 17.1 | |
| 16.1 | 16.5 | 16.5 | 16.6 | 17.2 | |
| 16.4 | 16.4 | 16.6 | 16.5 | 16.6 | |
| 16.5 | 16.2 | 16.1 | 16.4 | 16.8 | |
| \(\overline{x}=\) | ________ | ________ | ________ | ________ | ________ |
| \({s}^{2}=\) | ________ | ________ | ________ | ________ | ________ |
State the hypotheses.
H0: ____________
Ha: ____________
Glossary
- Analysis of Variance
- also referred to as ANOVA, is a method of testing whether or not the means of three or more populations are equal. The method is applicable if:
- all populations of interest are normally distributed.
- the populations have equal standard deviations.
- samples (not necessarily of the same size) are randomly and independently selected from each population.
The test statistic for analysis of variance is the F-ratio.
- One-Way ANOVA
- a method of testing whether or not the means of three or more populations are equal; the method is applicable if:
- all populations of interest are normally distributed.
- the populations have equal standard deviations.
- samples (not necessarily of the same size) are randomly and independently selected from each population.
The test statistic for analysis of variance is the F-ratio.
- Variance
- mean of the squared deviations from the mean; the square of the standard deviation. For a set of data, a deviation can be represented as x – \(\overline{x}\) where x is a value of the data and \(\overline{x}\) is the sample mean. The sample variance is equal to the sum of the squares of the deviations divided by the difference of the sample size and one.
